Global ETF Survey Is Live! 600+ ETF Professionals Weigh In. See Results →



ETF Comparison: iShares U.S. Home Construction ETF (ITB) Versus State Street SPDR S&P Homebuilders ETF (XHB)
Homebuilder stocks are back in the news cycle, and both of these ETFs provide targeted exposure but via significantly different methodologies.

Keep up with what matters in ETFs
Get timely ETF insights, market trends, and top ideas straight to your inbox.
Your newsletter subscriptions with us are subject to ETF Central's Privacy Policy and Terms and Conditions.
The U.S. housing market has been somewhat overshadowed by AI hyperscaler earnings and the midterm elections, but a steady stream of economic developments in recent weeks has important implications for homebuilder stocks. The industry remains caught between competing forces.
Elevated mortgage rates and affordability constraints continue to weigh on prospective buyers, while builders face pressure to offer incentives, including mortgage-rate buydowns and price reductions, to move inventory. At the same time, years of constrained housing supply, demographic demand and the possibility of lower financing costs provide reasons for longer-term optimism.
The latest figures illustrate just how difficult conditions have become. According to the National Association of Home Builders, builder confidence fell to 29 in October, its lowest reading since June 2012. Mortgage rates had climbed above 7%, while 43% of builders reported cutting prices and 65% were offering sales incentives to attract buyers.
Yet some major investors are taking a more constructive view. Berkshire Hathaway completed its $8.5 billion acquisition of Taylor Morrison in July, taking the homebuilder private and combining it with Berkshire's existing site-built housing operations. Berkshire has also continued accumulating shares of Lennar. Its latest publicly reported holdings, as of June 30, included approximately 13.1 million Class A shares worth $1.19 billion, up nearly 30% from the previous quarter.
I think all this makes homebuilders an interesting industry to examine. The near-term economic backdrop remains challenging, but Berkshire's investments suggest that at least some long-term capital allocators see value in the sector despite weak sentiment.
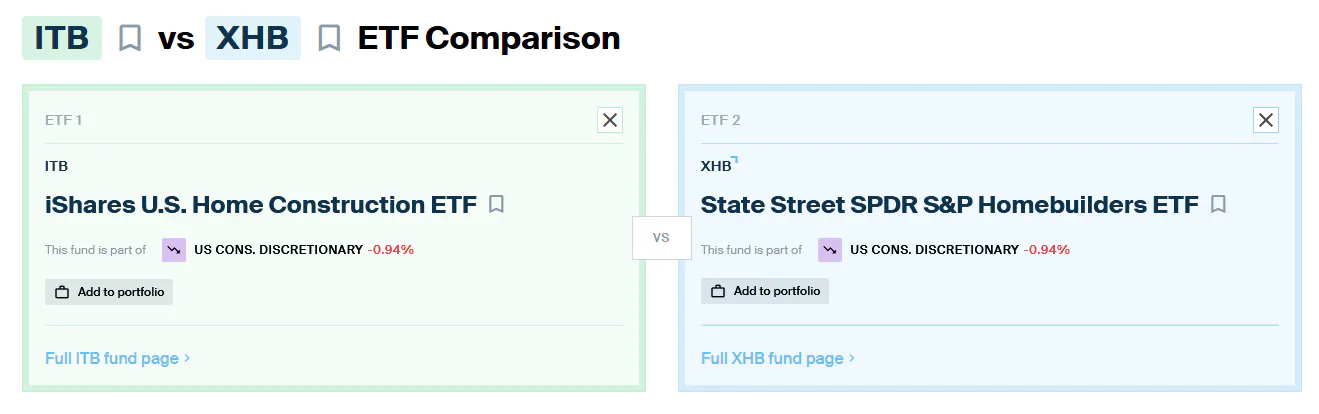
As with many industries, investors can access homebuilders through exchange-traded funds. The selection is relatively limited, though. While I have a fondness for underdog contenders such as the Hoya Capital Housing ETF
In this case, it's the iShares U.S. Home Construction ETF
Let's see how they stack up head-to-head using ETF Central's Comparison Tool across our usual three categories: total cost of ownership, methodology and exposure, and risk and return.
Global ETF Survey 2026 is Live!
With 1,790 new products launched by July 2026, choosing is harder than ever. Our Global ETF Survey 2026, built on 620 professional investors and allocators, shows how active, fixed income, options-based and thematic ETFs are reshaping fund selection.
ITB vs. XHB: Total Cost of Ownership
Both ITB and XHB are passively managed, index-tracking ETFs. However, investors shouldn't expect the rock-bottom fees associated with broad-market or even sector-specific index funds. Narrowing the focus to a particular industry generally comes with a modest increase in expenses.
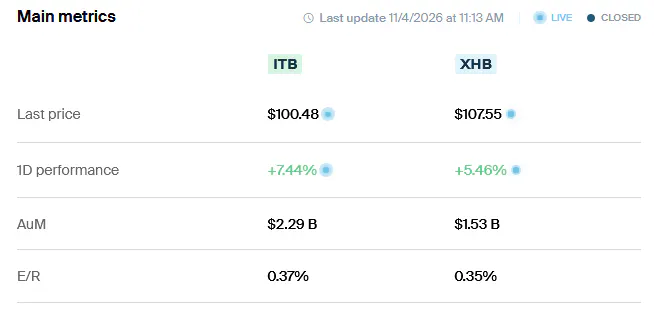
Still, both ETFs remain reasonably priced. XHB has a slight advantage, charging a 0.35% expense ratio compared with 0.37% for ITB. On a $10,000 investment, that translates to $35 versus $37 in annual fund expenses, a difference of just $2.
Because industry-specific ETFs are frequently used as short-term tactical trading vehicles, it's also worth examining liquidity. The bid-ask spread represents an additional transaction cost when entering or exiting a position, making it particularly relevant for investors who trade frequently.
Here, ITB has a slight advantage, with a 30-day median bid-ask spread of 0.027%, compared with 0.039% for XHB. That suggests investors may face marginally lower trading costs with ITB, although the difference is relatively small.
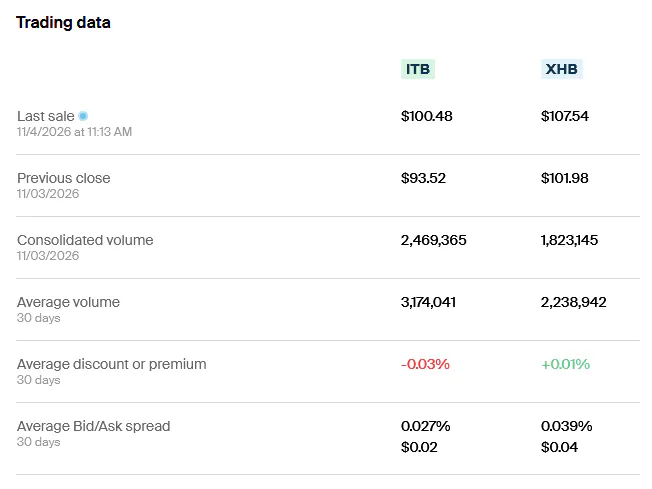
Verdict: Factoring in both expense ratios and bid-ask spreads, XHB retains a slight cost advantage for a typical buy-and-hold investor, although frequent traders could find ITB more competitive. The difference is small enough that I'd be inclined to call this a tie, but technically, XHB wins on ongoing expenses.
ITB vs. XHB: Methodology and Exposure
When buying a passive ETF, it's important to examine the underlying benchmark closely. Although ITB and XHB both target the homebuilding industry, their index methodologies produce substantially different portfolios.
Let's start with ITB, which tracks the Dow Jones U.S. Select Home Construction Index. Its portfolio currently contains 43 holdings, covering the major publicly traded U.S. homebuilders alongside companies providing the products and services needed to construct residential properties.
XHB tracks the S&P Homebuilders Select Industry Index, which takes a similarly expansive approach. Alongside homebuilders, it includes companies involved in building products, home improvement retail, home furnishings and household appliances.
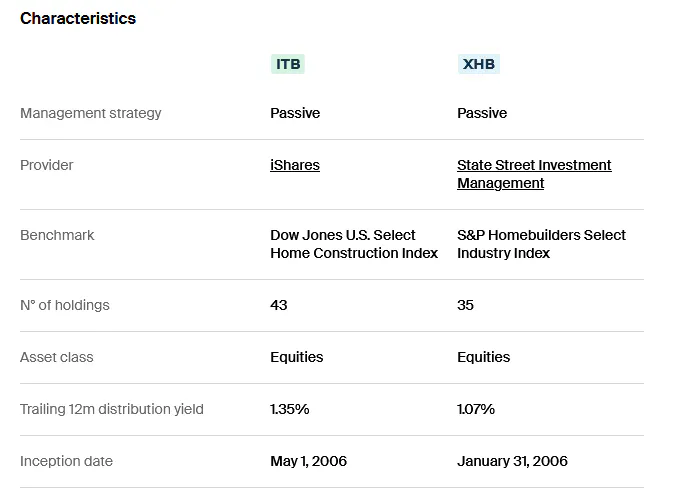
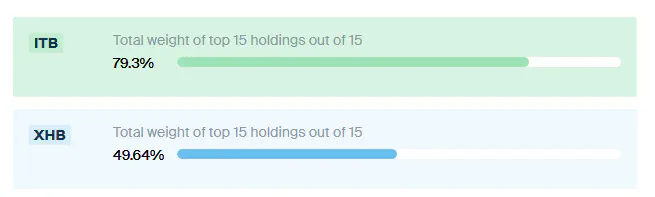
ITB is market-cap weighted, while XHB follows a modified equal-weight approach. Consequently, ITB has substantially greater concentration in its largest holdings, with 79.3% of its portfolio allocated to the top 15 stocks, compared with just 49.6% for XHB.
Looking at the individual holdings makes the distinction even clearer. ITB assigns substantial weight to the industry's largest homebuilders, including D.R. Horton, PulteGroup, Lennar, NVR and Toll Brothers. These companies collectively account for a significant portion of the U.S. new-home construction market, making their earnings, order backlogs and pricing decisions particularly relevant.
XHB’s modified equal-weight methodology gives smaller companies considerably more influence. Between quarterly rebalances, stocks that outperform can temporarily rise to the top of the holdings list. Interestingly, none of the five major homebuilders mentioned above currently appears among XHB's five largest positions. Instead, its leading holdings reflect a broader collection of companies operating around the homebuilding industry, including smaller building products and home-related businesses.
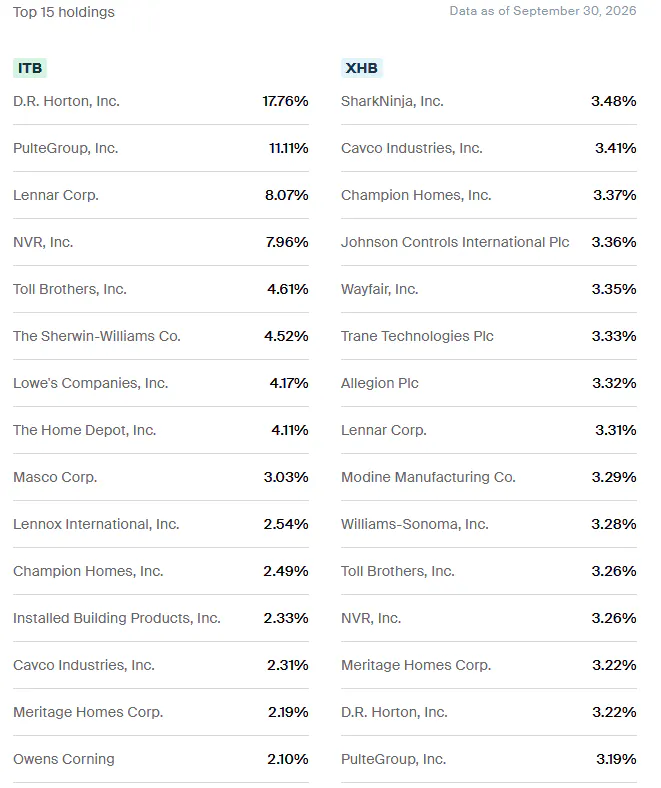
Verdict: For investors specifically seeking exposure to U.S. homebuilders, I personally prefer ITB. Its market-cap-weighted methodology ensures that the industry's largest and most influential companies receive appropriately substantial allocations. XHB offers broader diversification and potentially greater upside when smaller housing-related businesses outperform, but its exposure is arguably more representative of the industry's periphery than its core.
ITB vs. XHB: Risk and Return
Both ETFs have delivered virtually flat returns year-to-date in 2026, reflecting the challenging environment facing the U.S. housing market. However, looking further back over the trailing three- and five-year periods, XHB has substantially outperformed ITB.
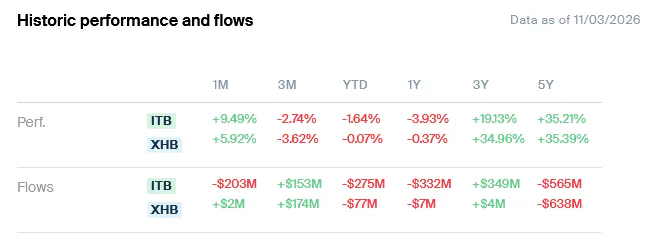
Interestingly, trading activity tells a somewhat different story. ITB has considerably higher trading volume and has experienced more volatile net fund flows, with substantial inflows and outflows across the periods examined. To me, that suggests ITB is the preferred vehicle for tactical traders looking to express short-term views on the homebuilding industry.
The risk metrics are even more interesting. Given XHB's greater representation of mid- and small-cap companies, one might reasonably expect it to be more volatile than ITB. Smaller companies generally have more limited access to capital and greater sensitivity to changes in economic conditions.
Yet that hasn't been the case. Across the trailing one-, three- and five-year periods, XHB has exhibited both lower annualized volatility and shallower maximum drawdowns than ITB. I suspect portfolio construction explains much of this counterintuitive result.
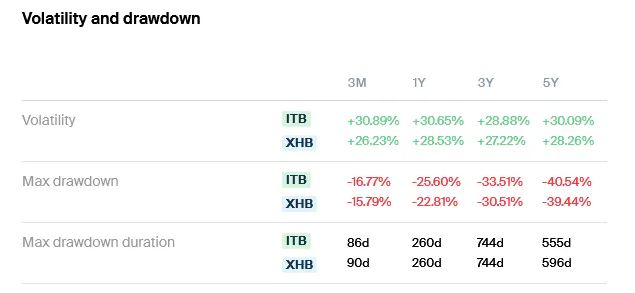
ITB's market-cap-weighted methodology concentrates a substantial portion of its assets in a handful of large homebuilders. Although these companies are well-established, their earnings remain highly cyclical, with considerable sensitivity to mortgage rates, housing affordability, construction costs and buyer sentiment. When the industry's largest builders move together in response to changing economic expectations, ITB's concentrated exposure can amplify those swings.
XHB, by comparison, spreads its allocations across a wider range of housing-related businesses. Home improvement retailers, building products manufacturers, household appliance companies and homebuilders don't necessarily respond identically to the same economic developments. Its modified equal-weight methodology also prevents a handful of large companies from dominating portfolio returns. That diversification appears to have more than offset the additional company-specific risks associated with its smaller-cap holdings, at least over the periods examined.
Verdict: With stronger trailing three- and five-year returns, lower annualized volatility and shallower maximum drawdowns across all three measurement periods, XHB takes this category. ITB remains a favored tactical trade for investors seeking concentrated exposure to major homebuilders, but XHB has demonstrated a more favorable combination of risk and return over the periods examined.
Please note that this article reflects the author’s personal views and does not represent the opinions of the publication or its affiliates. It is for informational purposes only and does not constitute investment advice. It is essential to seek guidance from a registered financial professional before making any investment decisions.

Latest ETF News
See all ETF newsETF Comparison: Vanguard Total World Stock ETF (VT) Versus Dimensional World Equity ETF (DFAW)

ETF Comparison: NEOS Russell 2000 High Income ETF (IWMI) Versus Global X Russell 2000 Covered Call ETF (RYLD)

ETF Comparison: NEOS Nasdaq-100 High Income ETF (QQQI) Versus Goldman Sachs Nasdaq-100 Premium Income ETF (GPIQ)




 Advantages of ETFs over Mutual Funds1/6
Lower Costs
In this guide, we'll explore the advantages of ETFs over mutual funds, giving you valuable insights into why ETFs have gained significant popularity among investors like yourself.
Leveraged ETFs: Unlocking the Potential for Amplified Returns1/6
Understanding Leveraged ETFs
Explore leveraged ETFs: potential for amplified returns & risks. 5 ETFs to consider across equities, commodities & fixed income.
What is a Leveraged ETF?1/6
Introducing Leveraged and Inverse ETFs
In this guide, we'll dive into the world of leveraged ETFs, exploring their definition, mechanics, potential risks, and rewards.
Recent educational content

ETF Trends
ETF Industry KPIs November 16, 2026
This week’s KPI data overview highlights key metrics and trends shaping the ETF landscape.

ETF Trends
ETF Industry KPIs November 9, 2026
This week’s KPI data overview highlights key metrics and trends shaping the ETF landscape.
ETF Trends
ETF Industry KPIs November 3, 2026
This week’s KPI data overview highlights key metrics and trends shaping the ETF landscape.

First Look ETF
First Look ETF: Income, International, and Cash Flow ETFs
In this season 6 episode of First Look ETF, Stephanie Stanton @etfguide examines the latest ETF marketplace trends with NYSE and guests.