Open Now: The Global ETF Survey Take the Survey →

ETF Comparison: iShares U.S. Aerospace & Defense ETF (ITA) Versus Global X Defense Tech ETF (SHLD)
The dominant U.S. aerospace and defense ETF goes head-to-head with an upstart thematic ETF competition in this week’s ETF comparison.

Keep up with what matters in ETFs
Get timely ETF insights, market trends, and top ideas straight to your inbox.
Your newsletter subscriptions with us are subject to ETF Central's Privacy Policy and Terms and Conditions.
One of the hottest thematic ETF categories in recent years has been aerospace and defense. The momentum started with Russia’s invasion of Ukraine, picked up again during the Israel-Hamas war, and recently intensified after U.S.-Israeli surgical strikes against Iran’s leadership and nuclear facilities.
ETF issuers have responded. What was once a sleepy corner of the market dominated by legacy funds from iShares, Invesco, and State Street has suddenly become competitive. One of the most well-known in this space is the iShares U.S. Aerospace & Defense ETF
But that changed in September 2023 when Global X launched the Global X Defense Tech ETF

The ETF Industry Is Evolving Fast
From AI infrastructure to active strategies, the ETF landscape is shifting. Share your perspective in the 7th Annual Global ETF Survey and get exclusive early access to the final report.
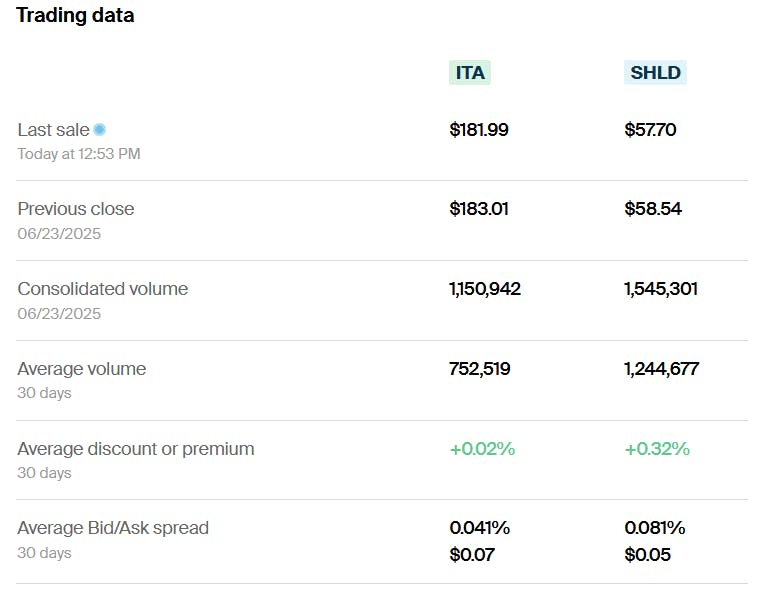
ITA vs SHLD: Total cost of ownership
On the surface, ITA

When it comes to implicit trading costs, ITA is again more cost-efficient. Its 30-day average bid-ask spread is just 0.041%, while SHLD’s is nearly double at 0.081%. Both are liquid, but if you're looking to minimize frictional costs, ITA wins out.
Verdict: Add it all up, and ITA is the cheaper aerospace and defense ETF to own.
ITA vs SHLD: Methodology and holdings
The benchmark index is where the difference between these two defense ETFs becomes night and day.

Starting with ITA, it tracks the Dow Jones U.S. Select Aerospace & Defense Index, a concentrated portfolio of 36 U.S.-listed companies weighted by market cap.
On the other hand, SHLD
Practically speaking, both ETFs feature U.S.-heavy portfolios, but less so for SHLD, which has 50% of its holdings outside the U.S, with a large focus on EU countries.
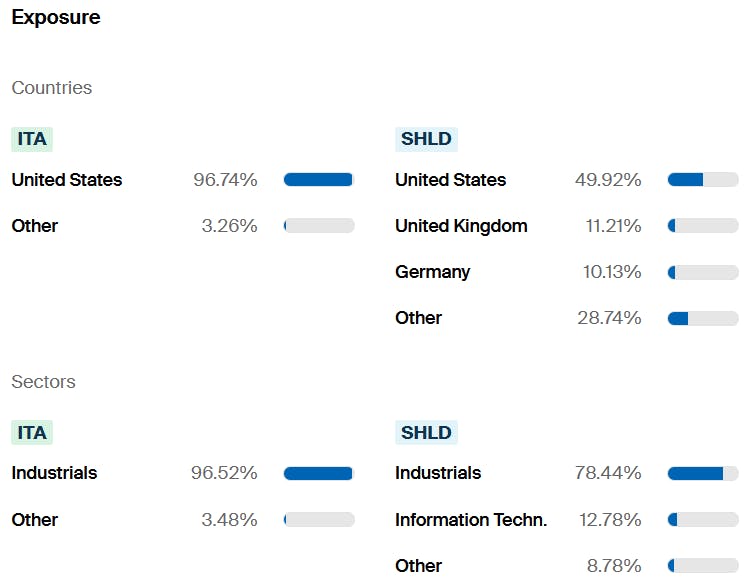
Both are top-heavy, but ITA is slightly heavier, at 87.19% of its weight, in the top 15 holdings, compared to 79.08% for SHLD.

In terms of the basket, ITA is extremely concentrated. Because it’s market cap weighted, a handful of big U.S. contractors dominate: GE Aerospace sits at 20.94%, RTX at 14.35%, and Boeing at 9.98%.
SHLD, on the other hand, is more evenly distributed and includes major non-U.S. names like Rheinmetall AG, BAE Systems, Leonardo, and SAAB. In addition, you’ll find intelligence contractors like Palantir, and unlike ITA, there’s less emphasis on pure-play aerospace contractors.

Verdict: I personally prefer SHLD. While ITA
ITA vs SHLD: Risk and return
Because SHLD is relatively new, it’s hard to draw long-term comparisons—but the short-term numbers are still worth examining.
On a one-year trailing basis and year to date, SHLD has massively outperformed ITA, both in terms of returns and flows. While SHLD has brought in fresh assets, ITA has actually posted net outflows over the past year.

Risk-wise, over the same period, SHLD has also been slightly less volatile, with both shorter and shallower maximum drawdowns than ITA.

Looking at a longer backtest from September 13, 2023, to June 23, 2025, SHLD posted an eye-popping 63.11% annualized return, compared to 34.81% for ITA.

Both ETFs benefited from conflict-driven tailwinds, but ITA’s focus on U.S. contractors has had some headwinds, namely defense procurement bottlenecks tied to political turnover and inefficiencies, as well as budget pressures.
By contrast, SHLD’s EU-heavy portfolio benefited from rearmament themes and higher defense budgets across Europe. Its inclusion of intelligence and cybersecurity firms like Palantir also gave it a performance edge.
Verdict: I don’t expect this level of outperformance to continue, but SHLD clearly won this round. The global diversification and broader take on modern defense gave it a big lift.
Please note that this article reflects the author’s personal views and does not represent the opinions of the publication or its affiliates. It is for informational purposes only and does not constitute investment advice. It is essential to seek guidance from a registered financial professional before making any investment decisions.


Latest ETF News
See all ETF newsHow Investors can Maximize Tax Efficiency with Income ETFs

Trump Accounts: Here's Which ETFs You Can Invest In

The Two Best Types of Fixed-Income ETFs For Managing Cash

ETF Comparison: Roundhill Generative AI & Technology ETF Versus iShares A.I. Innovation and Tech Active ETF


 Advantages of ETFs over Mutual Funds1/6
Lower Costs
In this guide, we'll explore the advantages of ETFs over mutual funds, giving you valuable insights into why ETFs have gained significant popularity among investors like yourself.
Leveraged ETFs: Unlocking the Potential for Amplified Returns1/6
Understanding Leveraged ETFs
Explore leveraged ETFs: potential for amplified returns & risks. 5 ETFs to consider across equities, commodities & fixed income.
What is a Leveraged ETF?1/6
Introducing Leveraged and Inverse ETFs
In this guide, we'll dive into the world of leveraged ETFs, exploring their definition, mechanics, potential risks, and rewards.
Recent educational content

ETF Trends
ETF Industry KPIs July 20, 2026
This week’s KPI data overview highlights key metrics and trends shaping the ETF landscape.
ETF Trends
ETF Industry KPIs July 13, 2026
This week’s KPI data overview highlights key metrics and trends shaping the ETF landscape.

First Look ETF
First Look ETF: Cash Deployment, Bond, and Hedged ETFs
In this season 6 episode of First Look ETF, Stephanie Stanton examines the latest ETF marketplace trends with NYSE and guests.

ETF Trends
ETF Industry KPIs July 6, 2026
This week’s KPI data overview highlights key metrics and trends shaping the ETF landscape.
Browse all educational columns

Build and Analyze Your ETF Portfolio Like a Pro
Create your own ETF portfolio in minutes and instantly see allocations, exposures, performance, and risk. Visualize diversification across asset classes, regions, and sectors. Stress-test ideas, compare benchmarks, and refine your strategy with professional-grade analytics.
