Keep tabs on your favorite ETFs with a personalized weekly tracker. Create a Watchlist now →



ETF Comparison: iShares Defense Industrials Active ETF (IDEF) Versus iShares U.S. Aerospace & Defense ETF (ITA)
BlackRock iShares has not one, but two defense industry ETFs. But which comes out on top, active management or passive indexing?

Keep up with what matters in ETFs
Get timely ETF insights, market trends, and top ideas straight to your inbox.
Your newsletter subscriptions with us are subject to ETF Central's Privacy Policy and Terms and Conditions.
I’m no stranger to how politics can intersect with ETFs. There have already been product launches tied to congressional trading activity on both sides of the aisle. Some policymakers have even traded ETFs themselves.
More recently, though, a lot of that attention has shifted toward prediction markets, where security clearances can create an edge. Now ETFs are back in the spotlight again, this time involving Secretary of War, (formerly Defense) Pete Hegseth.
The Financial Times recently reported that Hegseth’s broker had attempted to purchase shares of the iShares Defense Industrials Active ETF
What stands out here is not necessarily the attempt itself, but the fund selection. IDEF is a relatively new ETF. Despite already gathering about $3.2 billion in AUM, it only launched on May 19, 2025. Funny enough, had Hegseth’s broker been successful, he would be down on his IDEF trade right now!
By comparison, the iShares U.S. Aerospace & Defense ETF
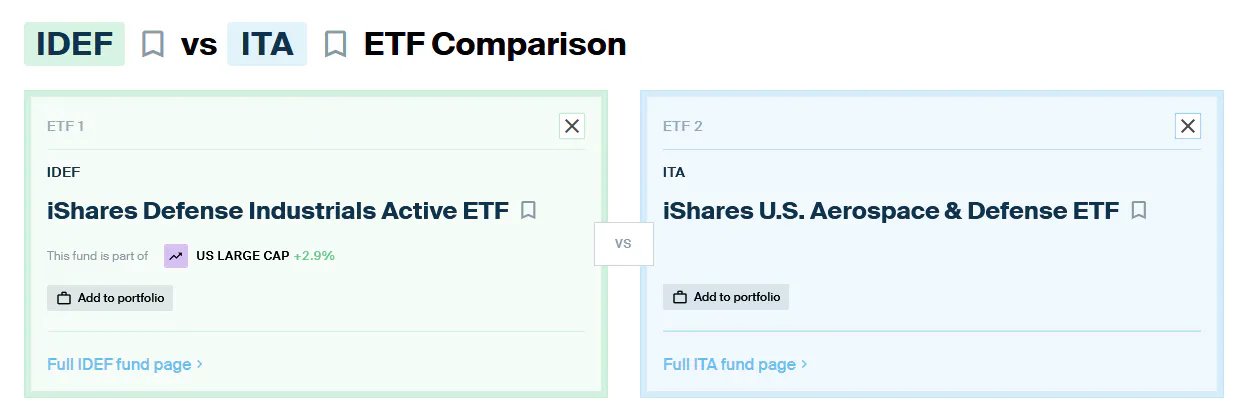
For those considering either approach, here’s how IDEF stacks up against ITA in a head-to-head look at active management versus passive indexing, using data from the ETF Central comparison tool.
Get data on 14,000+ ETFs
Access Trackinsight's reliable and comprehensive data with 500M+ points on 14,000+ ETFs.
IDEF vs ITA: Total Cost of Ownership
There is a common misconception that all passive ETFs are cheap. That tends to hold for broad market exposures, but as you move into narrower segments like sectors, industries, and especially thematic strategies, fees can climb quickly and start to resemble active management.
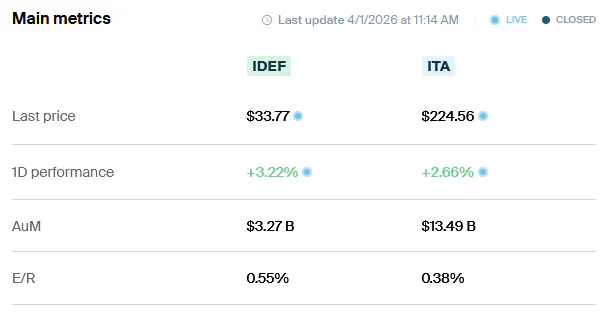
ITA is a good example of that. With a 0.38% expense ratio, it sits somewhere in the middle of the pack for a niche industry ETF. That is noticeably higher than what you would pay for something like an S&P 500 ETF at 0.03%, and it may raise some eyebrows for cost-conscious investors.
IDEF is even more expensive at 0.55%. That is typical for an actively managed ETF, where you are paying for portfolio management, research, and security selection. On a $10,000 investment, that works out to about $38 per year for ITA versus $55 for IDEF.
Trading costs also matter, especially if you are not holding these long term. The bid-ask spread, which reflects the cost of entering and exiting positions, can materially impact returns for more active traders.
Here, ITA has a clear advantage. Its 30-day median bid-ask spread is just 0.039%, reflecting strong liquidity. IDEF is much wider at 0.205%, meaning it is more expensive to trade in and out of.
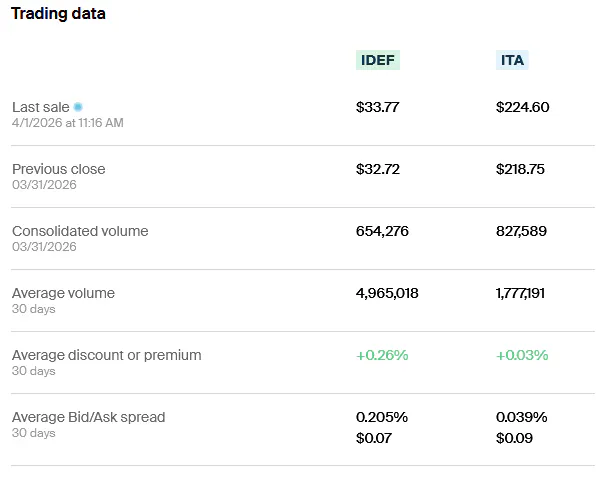
Verdict: When you factor in both expense ratios and trading costs, ITA is the cheaper ETF to buy-and-hold and trade by far.
IDEF vs ITA: Methodology and Holdings
This is where the comparison gets more interesting. At its core, this is a classic benchmark-tracking strategy versus an actively managed portfolio with discretion to pick and choose exposures.
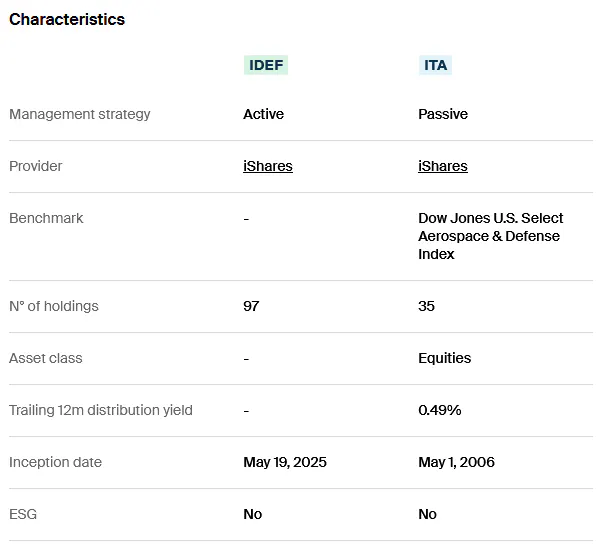
Starting with ITA, it tracks the Dow Jones U.S. Select Aerospace & Defense Index. In practice, that results in a relatively narrow portfolio, market-cap weighted and selected based on having significant revenue tied to aerospace or defense activities. The methodology is clearly defined, and you can dig into index documents, backtests, and supporting research to understand exactly what is driving performance.
IDEF is far more opaque. It is actively managed by Simon Wen, Yasmin Messner, and Lucy Parker, and like most active strategies, it functions more like a black box. The mandate is broadly defined around capturing companies that may benefit from increased government defense spending and geopolitical fragmentation, but there is less clarity on how positions are selected or weighted.
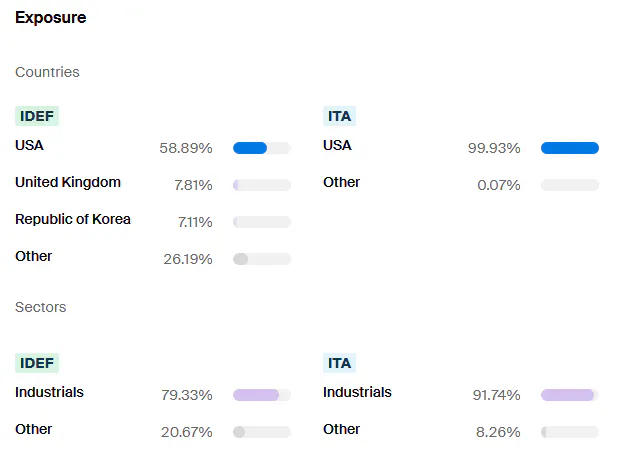
Looking at the portfolio helps fill in the gaps. ITA is almost entirely U.S.-focused, while IDEF is more globally diversified, with the U.S. making up just under 60% of the portfolio and meaningful exposure to markets like the U.K. and South Korea.
Both ETFs are heavily tilted toward industrials, which is expected, given the nature of defense contractors. However, IDEF extends beyond traditional defense names into adjacent sectors like information technology, materials, and energy. This reflects its active flexibility, allowing it to include companies involved in areas like infrastructure and cybersecurity that support defense ecosystems.
Diversification is another key point of differentiation. IDEF is far less concentrated, with its top 15 holdings making up about 47% of the portfolio. ITA, by contrast, is much more top-heavy, with its top 15 holdings accounting for 85.4%. That is a direct result of its market-cap weighting.
This also shows up at the individual holding level. ITA is dominated by large-cap names like GE Aerospace and RTX, which carry outsized weights due to their size. IDEF spreads its exposure more evenly across prime U.S. defense contractors such as RTX, Lockheed Martin, General Dynamics, and Northrop Grumman, while also incorporating names like Palantir, which sits outside traditional GICS defense classifications but plays a clear role in modern defense infrastructure.
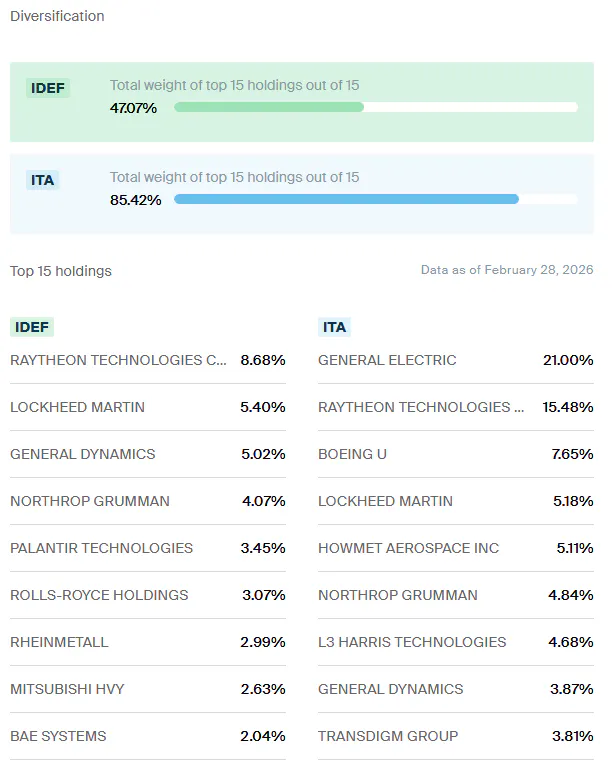
Verdict: IDEF gets the edge here. The active approach provides broader diversification, global exposure, and the flexibility to include adjacent industries that are increasingly important to modern defense. In this case, that added discretion results in a more balanced and forward-looking portfolio.
IDEF vs ITA: Risk and Returns
The comparison here is naturally limited by IDEF’s relatively recent launch, but ETF Central’s comparison tool data still provides a useful snapshot.
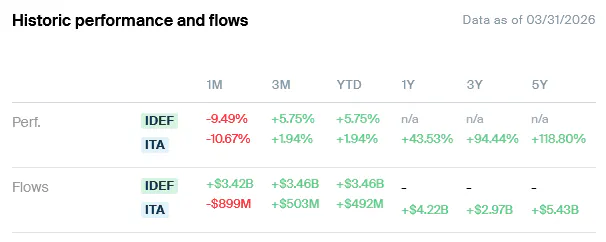
On a year-to-date and trailing three-month basis, IDEF has outperformed ITA by a meaningful margin. In plain terms, this is what investors would call alpha. The portfolio managers’ security selection and weighting decisions have, at least so far, translated into a clear performance advantage.
That performance has not gone unnoticed. IDEF has attracted over $3.4 billion in inflows over the same period. ITA has also seen inflows, but at just under $500 million, which is notable given that it is the larger and more established fund.
Risk comparisons are more constrained due to the shorter history, but the available data suggests both ETFs are broadly similar. Trailing three-month volatility is comparable, and maximum drawdown depth and duration are also closely aligned. In other words, the excess returns from IDEF have not come with a meaningful increase in observed risk, at least over this limited window.
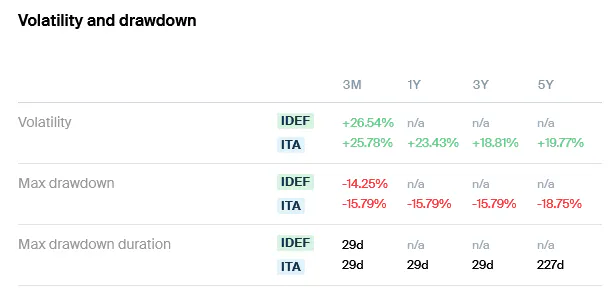
Verdict: Over the short to intermediate term, IDEF has delivered higher returns with similar or even slightly lower risk. That is the hallmark of successful active management, where security selection and portfolio construction add value beyond a passive benchmark, even after accounting for higher fees and potential style drift over time.
Please note this article is for information purposes only and does not in any way constitute investment advice. It is essential that you seek advice from a registered financial professional prior to making any investment decision.

Latest ETF News
See all ETF newsHow Some ETF Issuers Use Their Own Funds for Cash Management

These Public-Private ETFs Invest in Polymarket and Anduril

There's an ETF for That? Frontier Markets

10-Year Treasury Yield Hits 5%: Which Bond ETFs Offer the Most Direct Exposure?




 Advantages of ETFs over Mutual Funds1/6
Lower Costs
In this guide, we'll explore the advantages of ETFs over mutual funds, giving you valuable insights into why ETFs have gained significant popularity among investors like yourself.
Leveraged ETFs: Unlocking the Potential for Amplified Returns1/6
Understanding Leveraged ETFs
Explore leveraged ETFs: potential for amplified returns & risks. 5 ETFs to consider across equities, commodities & fixed income.
What is a Leveraged ETF?1/6
Introducing Leveraged and Inverse ETFs
In this guide, we'll dive into the world of leveraged ETFs, exploring their definition, mechanics, potential risks, and rewards.
Recent educational content

ETF Trends
ETF Industry KPIs October 5, 2026
This week’s KPI data overview highlights key metrics and trends shaping the ETF landscape.

ETF Trends
ETF Industry KPIs September 28, 2026
This week’s KPI data overview highlights key metrics and trends shaping the ETF landscape.
ETF Trends
ETF Industry KPIs September 22, 2026
This week’s KPI data overview highlights key metrics and trends shaping the ETF landscape.

First Look ETF
First Look ETF: Income, Corporate Arbitrage, and Growth and Value Investing
First Look ETF September 2026: iCapital, Mast Investments and North Square unpack new ETFs targeting monthly income, merger arbitrage and complementary growth and value exposure.

Browse all educational columns



ETFs’ Next Act: From Access to Selection
With 1,790 new products launched by July 2026, choosing is harder than ever. Our Global ETF Survey 2026, built on 620 professional investors and allocators, shows how active, fixed income, options-based and thematic ETFs are reshaping fund selection.