Open Now: The Global ETF Survey Take the Survey →

ETF Comparison: Invesco QQQ ETF (QQQ) Versus Vanguard Information Technology ETF (VGT)
Both ETFs deliver concentrated exposure to dominant U.S. listed tech firms but go about it in very different ways.

Keep up with what matters in ETFs
Get timely ETF insights, market trends, and top ideas straight to your inbox.
Your newsletter subscriptions with us are subject to ETF Central's Privacy Policy and Terms and Conditions.
As of April 1, the S&P 500 is already 30% weighted to technology—and no, that’s not an April Fool’s joke. The index has become increasingly concentrated in a single sector, and top-heavy to boot.
Many of the usual suspects—Apple, Amazon, Alphabet, Meta, NVIDIA, Tesla, and Microsoft—dominate the upper tiers of the index, reflecting the sheer market cap weight of the so-called “Magnificent Seven.”
For investors looking to go even further overweight tech, there’s no shortage of ETFs to help. Today, we’ll be putting two of the largest by assets under management head-to-head to see which stands out.
Here’s what the ETF Central comparison tool says when it comes to the Invesco QQQ Trust

Get data on 14,000+ ETFs
Access Trackinsight's reliable and comprehensive data with 500M+ points on 14,000+ ETFs.
QQQ vs. VGT: Total Cost of Ownership
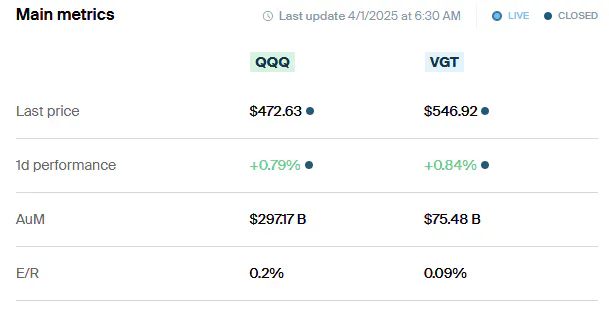
On expense ratio alone, VGT wins easily at 0.09%, after Vanguard trimmed it down from 0.10% earlier this year. QQQ, by comparison, charges 0.20%—not egregious on its own, but relatively expensive in 2025’s ultra-competitive ETF landscape.
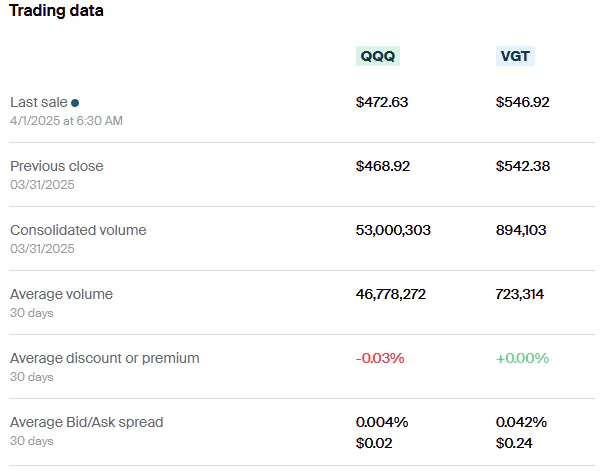
When it comes to implicit costs, QQQ is one of the most liquid ETFs on the market, with a 390-day median bid/ask spread of just 0.004%. That means it costs virtually nothing to trade. VGT is still highly liquid, but its spread is higher at 0.042%, which could matter more for frequent traders.
Verdict: When combining expense ratio and trading costs, VGT is still clearly cheaper to own over the long term. Don’t expect Invesco to cut QQQ’s fees anytime soon—at nearly $300 billion in assets, it remains one of the firm’s most lucrative products.
QQQ vs. VGT: Methodology and Exposure
Both ETFs provide clear and concentrated exposure to the tech sector—but they get there in very different ways.
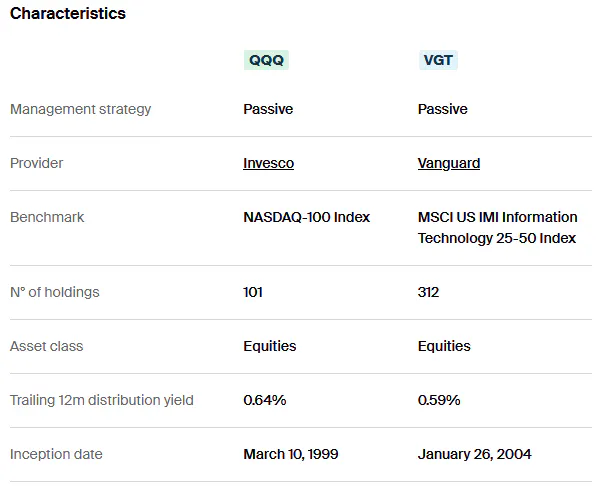
QQQ tracks the Nasdaq-100 Index, a relatively simple benchmark built on three main rules: exclude financials, take the 100 largest non-financial stocks listed on the Nasdaq, and weight them by market cap. That’s about it.
Historically, because the Nasdaq exchange attracted many tech-heavy growth companies, the index evolved into a quasi-tech benchmark—even though it was never designed specifically for that purpose.
VGT, on the other hand, is far more intentional. It tracks the MSCI US Investable Market Information Technology 25/50 Index, which includes over 300 large-, mid-, and small-cap U.S. companies classified under the GICS (Global Industry Classification Standard) tech sector.
That includes traditional segments like semiconductors, software, tech hardware, cloud computing, and data centers. But there’s a catch.
Because GICS classifications don’t always line up with public perception, VGT excludes companies like Amazon and Tesla (classified as consumer discretionary) and Meta and Alphabet (grouped under communication services). So, while VGT is tech in the purest GICS sense, it can feel narrower than expected.
Despite holding more stocks, VGT is more concentrated in tech than QQQ. QQQ includes a broader mix of sectors—mostly tech, but also big names in consumer discretionary, communication services, and even consumer staples like Costco and Pepsi, which just happen to list on the Nasdaq. VGT is also more top-heavy, with a larger share of assets tied up in its top few names.
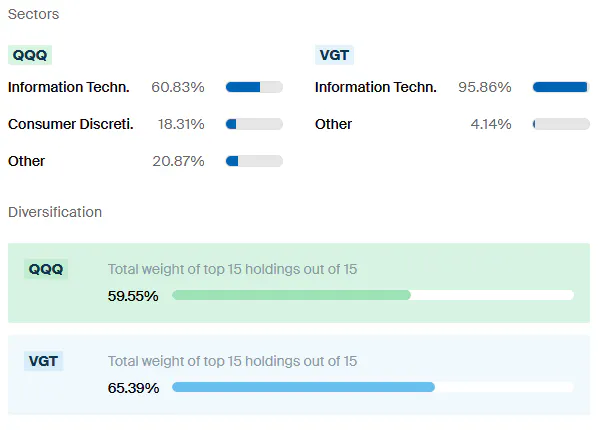
Verdict: While I’m not a fan of how QQQ selects stocks based on which exchange they’re listed on, it does offer slightly more diversification and arguably better reflects the real-world footprint of modern tech, even if that’s by accident. VGT, though more narrowly defined, sticks strictly to GICS sector lines.
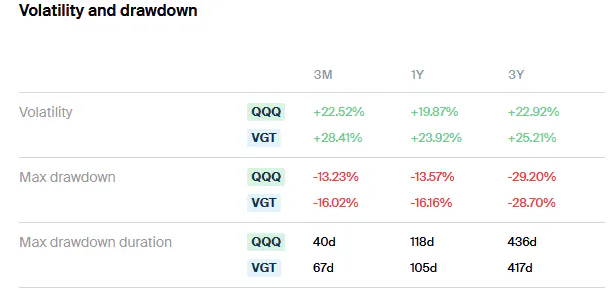
QQQ vs. VGT: Risk and Return
Unsurprisingly, both ETFs have been strong performers over the short term, with impressive three-year annualized returns—though both have taken a hit year to date amid the broader market pullback. Still, investor appetite remains robust, especially for QQQ, which has seen $5.2 billion in net inflows so far in 2025 despite the downturn.

On the risk side, VGT has historically been more volatile, with a higher standard deviation and deeper max drawdowns. That’s largely due to its pure-play tech exposure. While QQQ is heavily tilted toward technology, it still includes companies from other sectors, which can help soften the blow during sharp sell-offs.
Looking at long-term performance from January 30, 2004, through March 31, 2025, QQQ edges out VGT with a 13.61% compound annual growth rate (CAGR) versus 13.01% for VGT. QQQ also delivered a higher Sharpe ratio of 0.63 vs. 0.59, indicating better risk-adjusted returns over that period.

Verdict: This one’s clear—VGT is too concentrated in a single GICS sector to serve as anything more than a tactical overweight. And while QQQ’s exchange-based index methodology has its flaws, its long-term results speak for themselves.
This article is for informational purposes only and does not in any way constitute investment advice. The author may express their own opinions, which may not represent the opinions of ETF Central or its affiliated partners. It is essential that you seek advice from a registered financial professional prior to making any investment decisions.
Mentioned ETFs
Further reading
Latest ETF News
See all ETF newsThere's an ETF for That? Emerging Markets Without China

Autocallables Versus Equity-Linked Notes: Pros and Cons for Derivative Income ETFs

ETF Contrarian Corner: Two Unloved Segments That Investors Are Ignoring


 Advantages of ETFs over Mutual Funds1/6
Lower Costs
In this guide, we'll explore the advantages of ETFs over mutual funds, giving you valuable insights into why ETFs have gained significant popularity among investors like yourself.
Leveraged ETFs: Unlocking the Potential for Amplified Returns1/6
Understanding Leveraged ETFs
Explore leveraged ETFs: potential for amplified returns & risks. 5 ETFs to consider across equities, commodities & fixed income.
What is a Leveraged ETF?1/6
Introducing Leveraged and Inverse ETFs
In this guide, we'll dive into the world of leveraged ETFs, exploring their definition, mechanics, potential risks, and rewards.
Recent educational content

Asset TV
The ETF Show - Investors Turn to Small Caps as Value Outperforms
After years of outflows, small caps have attracted interest as the Russell 2000 outperforms the broad market. Chris Parker, Senior Portfolio Manager from Thrivent Asset Management joins the ETF Show to discuss.


ETF Trends
ETF Industry KPIs 6/29/2026
This week’s KPI data overview highlights key metrics and trends shaping the ETF landscape:
ETF Trends
ETF Industry KPIs June 22, 2026
The ETF Industry saw 40 New Launches and 23 closures last week.

Asset TV
The ETF Show - New Autism-Impact ETF Launched
Defiance ETFs has launched the first ETF, $ASD, focused on the autism ecosystem, investing in companies that provide services, products, and research related to autism and neurodivergence.
Browse all educational columns

Have you tried our ETF Compare tool?
Compare ETFs like a pro. Analyze fees, performance, exposure & holdings side-by-side.