Open Now: The Global ETF Survey Take the Survey →

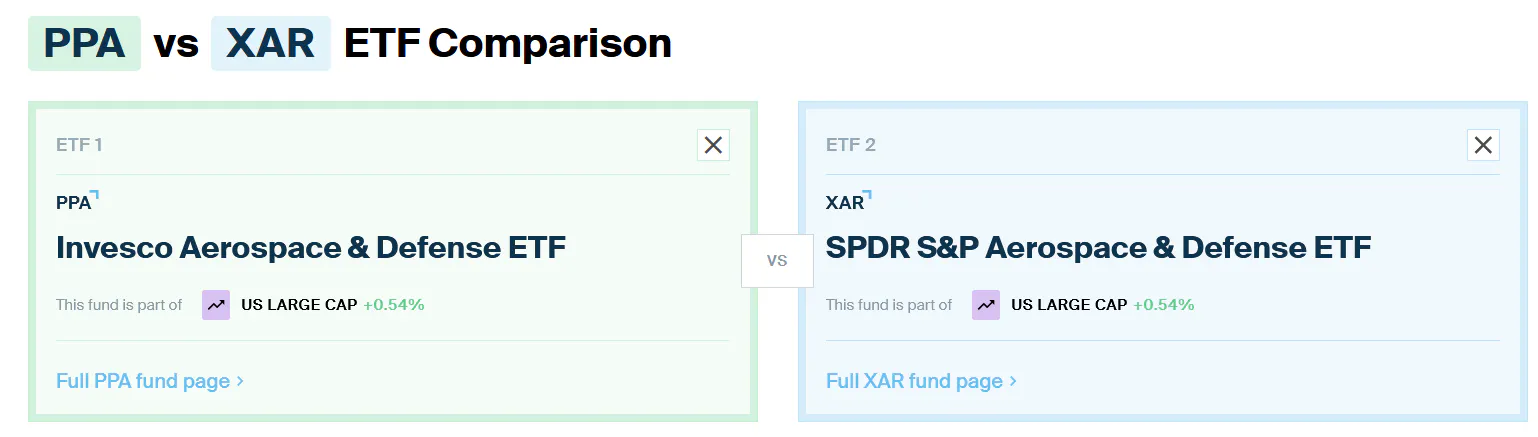
ETF Comparison: Invesco Aerospace & Defense ETF (PPA) Versus SPDR S&P Aerospace & Defense ETF (XAR)
Two competing, NYSE-listed aerospace and defense ETFs with drastically different methodologies go head-to-head in this week’s ETF comparison.

Keep up with what matters in ETFs
Get timely ETF insights, market trends, and top ideas straight to your inbox.
Your newsletter subscriptions with us are subject to ETF Central's Privacy Policy and Terms and Conditions.
Last week, we put the long-running iShares U.S. Aerospace & Defense ETF
For years, ITA was part of a trio of dominant aerospace and defense ETFs, each managing over $1 billion. The other two members of that group are the Invesco Aerospace & Defense ETF
All three ETFs share exposure to the same industry, but that’s where the similarities end. PPA and XAR, in particular, follow drastically different rulebooks when it comes to selecting and weighting their holdings. Here’s how they stack up, using the ETF Central comparison tool.
The ETF Industry Is Evolving Fast
From AI infrastructure to active strategies, the ETF landscape is shifting. Share your perspective in the 7th Annual Global ETF Survey and get exclusive early access to the final report.
PPA vs XAR: Total cost of ownership
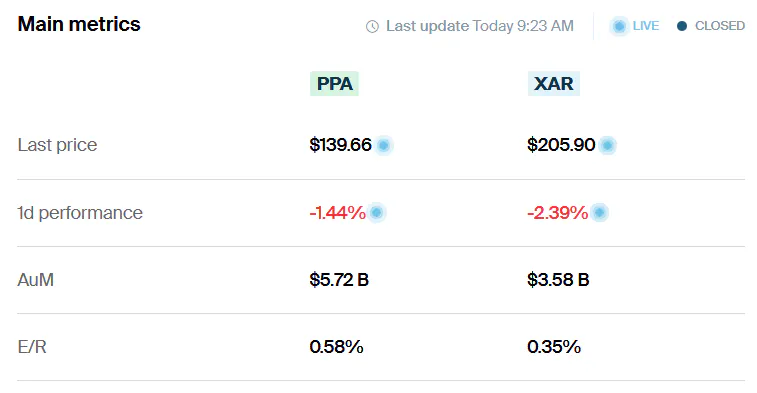
Industry-specific ETFs like these have never been cheap, but some stand out as better deals than others. On headline fees alone, XAR is the more affordable option with a 0.35% expense ratio, compared to PPA’s 0.58%.
When it comes to trading costs, PPA holds a slight edge. Its 30-day average bid-ask spread is 0.05%, slightly tighter than XAR’s 0.074%.
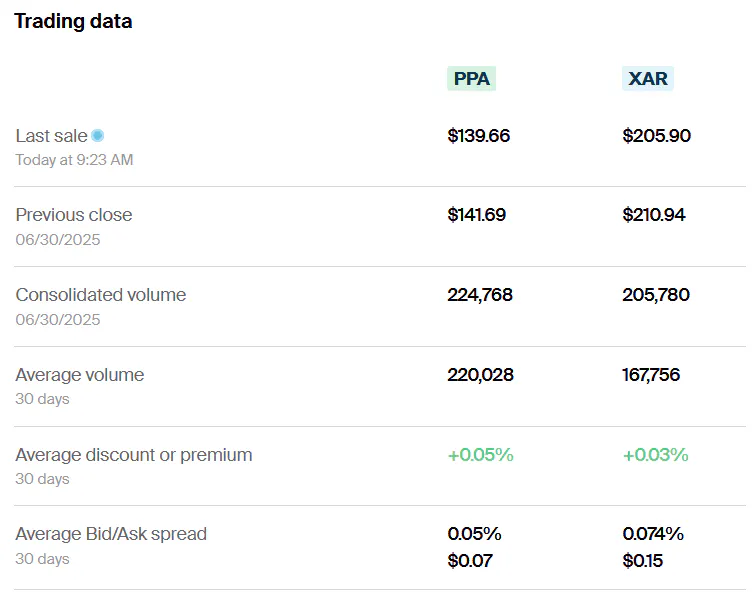
Verdict: Even after factoring in spreads, XAR still comes out ahead on total cost of ownership. It’s the cheaper ETF to hold for most investors.
PPA vs XAR: Methodology and holdings
Both PPA and XAR passively track U.S.-listed aerospace and defense stocks, but that’s where the similarity ends. Their selection and weighting methodologies are fundamentally different.
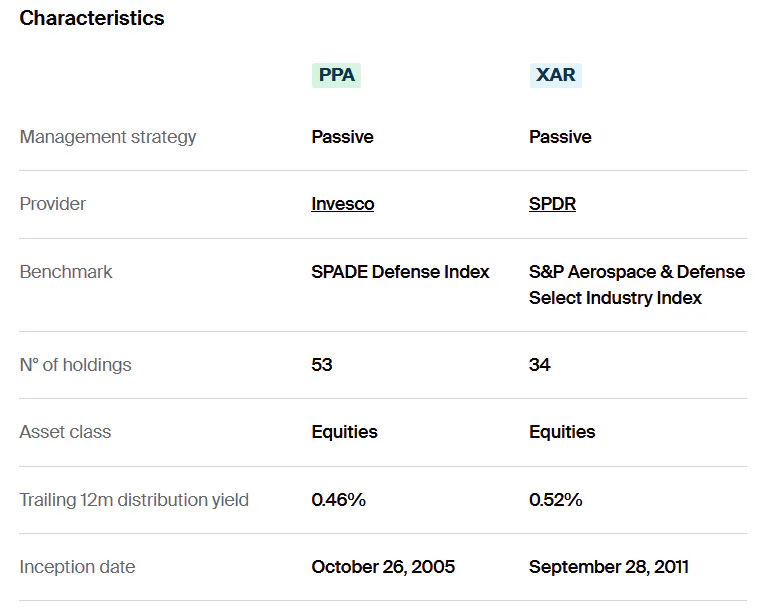
PPA tracks the SPADE Defense Index, a custom benchmark developed by a specialized defense research firm rather than a large index provider. The index targets “systematically important” defense firms, which are defined as “companies whose removal would significantly impact the capabilities of the U.S. Department of Defense.” The fund currently holds 53 stocks.
To be eligible, companies must meet minimum thresholds for market cap, share price, volume, and quarterly revenue from relevant business activities. There’s no country-of-origin requirement, just U.S. exchange listing (NYSE or Nasdaq).
Though technically market cap weighted, PPA uses a “TrueCap” methodology that narrows the weighting down to the portion of a company’s business tied directly to defense, aerospace, homeland security, or space. That helps mitigate the overweights to massive conglomerates whose defense arms may only represent a fraction of total revenue.
By contrast, XAR tracks the S&P Aerospace & Defense Select Industry Index, which takes a far simpler approach: equally weight all qualifying stocks in the sector. It currently spans 35 companies from the broader S&P Total Market Index.
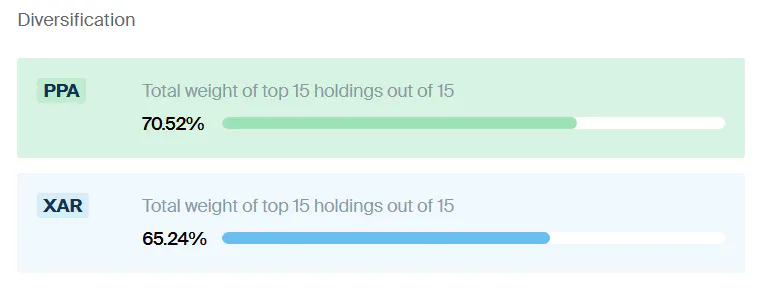
This leads to a very different portfolio. XAR is less top-heavy, as its top 15 holdings make up about 65% of the portfolio, compared to PPA’s 70%. But in XAR, the top holdings are simply the stocks that have outperformed since the last rebalance.
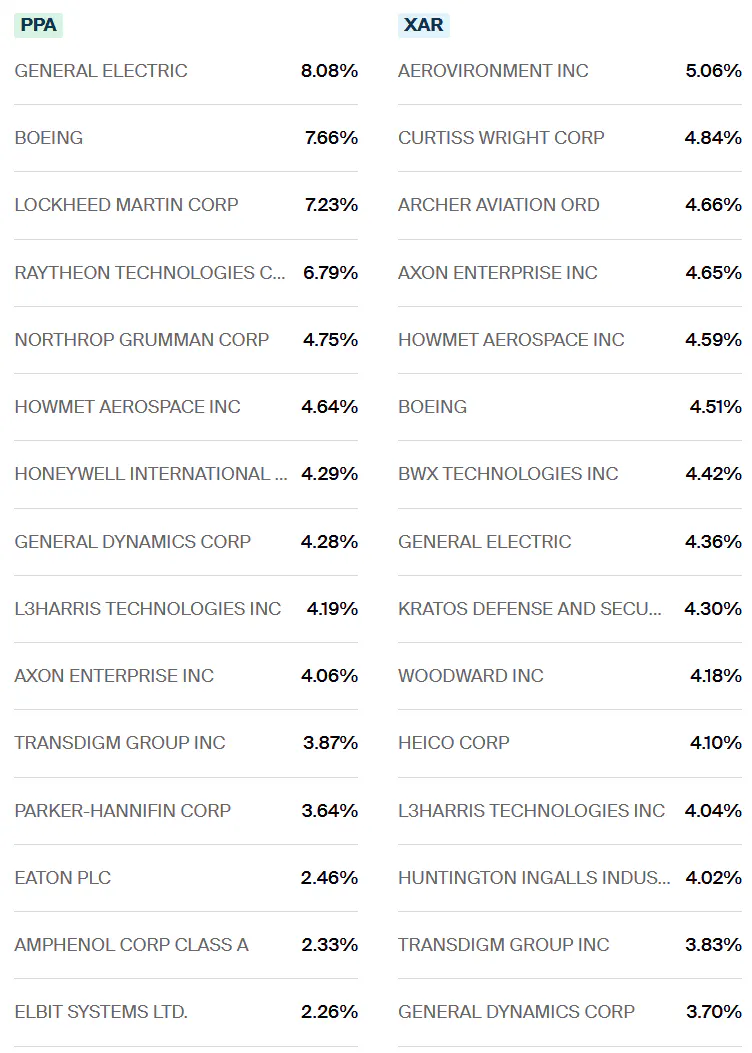
Meanwhile, PPA’s top holdings skew toward the big prime contractors: GE Aerospace, Boeing, Lockheed Martin, RTX, Northrop Grumman, General Dynamics, and L3Harris. In contrast, XAR is currently overweight a number of smaller players like AeroVironment and Archer Aviation that have had strong recent runs.
Verdict: I prefer PPA. The TrueCap methodology is a thoughtful way to balance exposure to major defense players without letting sprawling conglomerates dominate the portfolio. It also avoids some of the performance-chasing quirks of equal weighting, especially in a concentrated industry like defense where the most strategically important firms tend to be large.
PPA vs XAR: Risk and return
Both ETFs have delivered strong performance recently, riding the post-COVID surge in global defense spending and geopolitical tension.
Over the trailing one- and three-year periods, XAR has strongly outperformed PPA on a total return basis. That said, PPA has attracted more net inflows during this time, suggesting greater investor confidence or preference for its structure, though XAR has held its own.
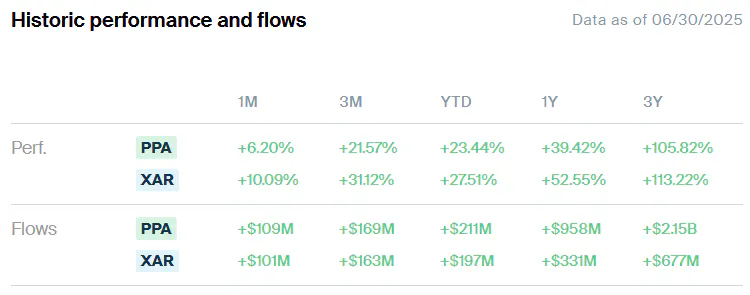
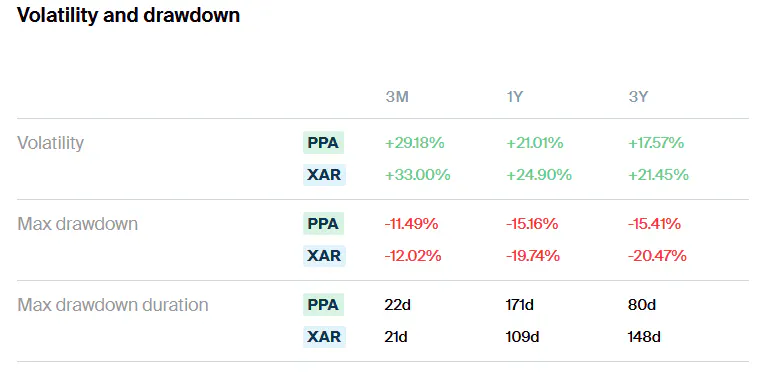
On the risk side, the trade-off is exactly what you’d expect. XAR’s equal-weighted strategy exposes it to smaller, more volatile companies. Over the same period, XAR has shown significantly higher volatility, a deeper maximum drawdown, and longer recovery periods compared to PPA.
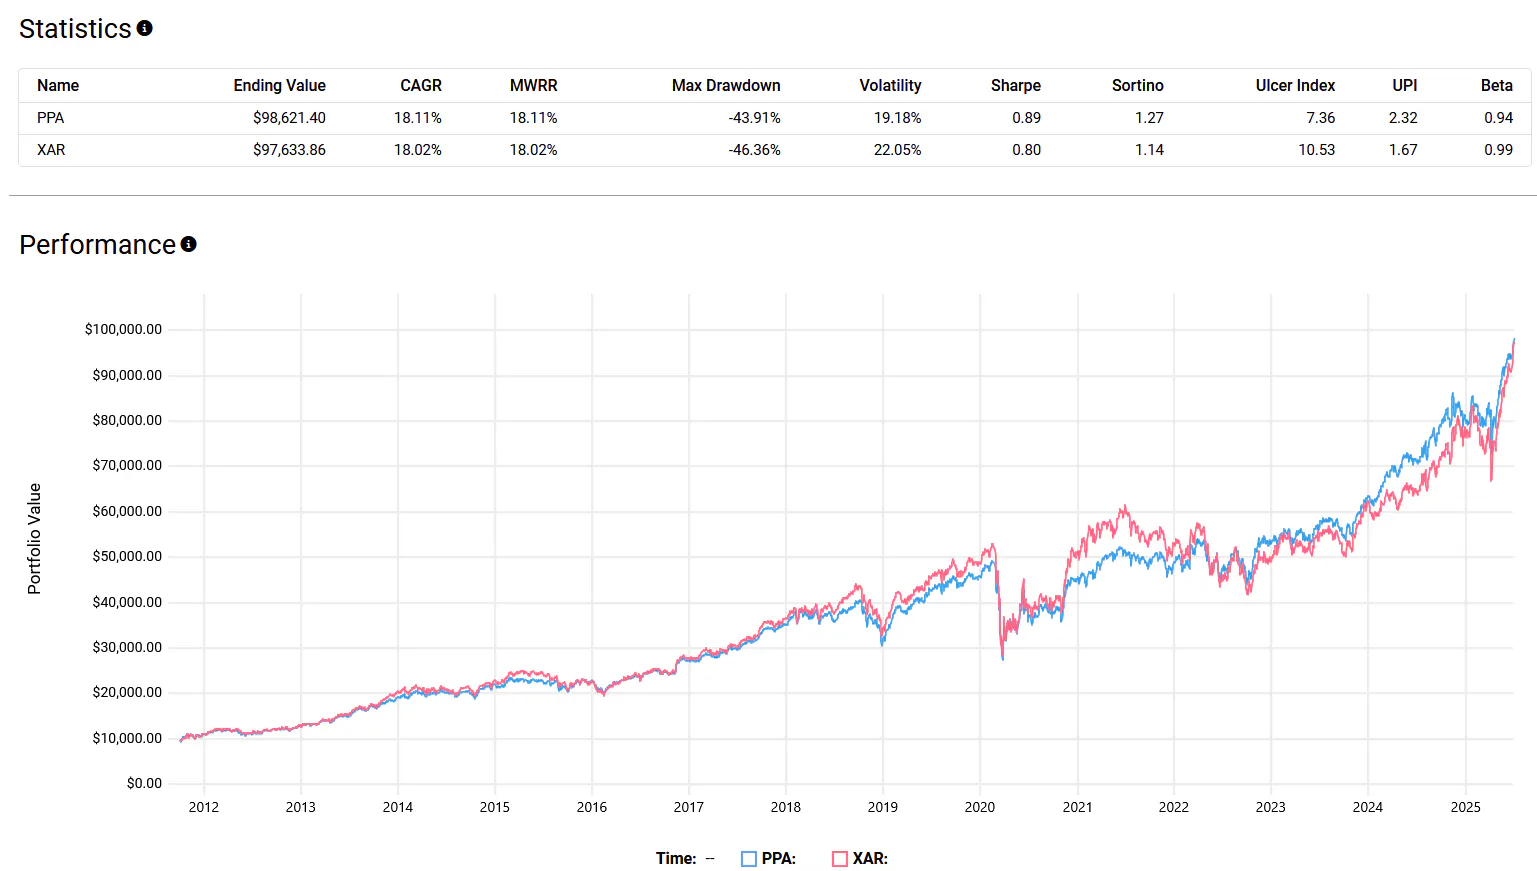
Looking at the long-term backtest from September 29, 2011, through June 30, 2025, PPA edges out a win with an annualized return of 18.11%, slightly ahead of XAR’s 18.02%. More importantly, PPA delivered a higher Sharpe ratio of 0.89 versus 0.80 for XAR, indicating better risk-adjusted performance over time.
Verdict: I prefer PPA. The returns have been nearly identical, but PPA got there with less volatility and better downside control. For investors looking for long-term exposure to aerospace and defense with more stable risk characteristics, I think PPA is the more consistent choice.
Please note that this article reflects the author’s personal views and does not represent the opinions of the publication or its affiliates. It is for informational purposes only and does not constitute investment advice. It is essential to seek guidance from a registered financial professional before making any investment decisions.
Topics
See all
Segments
See all
Mentioned ETFs
Further reading

Latest ETF News
See all ETF newsThere's an ETF for That? Emerging Markets Without China

Autocallables Versus Equity-Linked Notes: Pros and Cons for Derivative Income ETFs

ETF Contrarian Corner: Two Unloved Segments That Investors Are Ignoring


 Advantages of ETFs over Mutual Funds1/6
Lower Costs
In this guide, we'll explore the advantages of ETFs over mutual funds, giving you valuable insights into why ETFs have gained significant popularity among investors like yourself.
Leveraged ETFs: Unlocking the Potential for Amplified Returns1/6
Understanding Leveraged ETFs
Explore leveraged ETFs: potential for amplified returns & risks. 5 ETFs to consider across equities, commodities & fixed income.
What is a Leveraged ETF?1/6
Introducing Leveraged and Inverse ETFs
In this guide, we'll dive into the world of leveraged ETFs, exploring their definition, mechanics, potential risks, and rewards.
Recent educational content

Asset TV
The ETF Show - The Evolution of Leveraged & Inverse ETFs
Leveraged and inverse ETFs have exploded in popularity over the past decade capturing more assets as retail traders seek to capture volatility.


Asset TV
The ETF Show - Investors Turn to Small Caps as Value Outperforms
After years of outflows, small caps have attracted interest as the Russell 2000 outperforms the broad market. Chris Parker, Senior Portfolio Manager from Thrivent Asset Management joins the ETF Show to discuss.

ETF Trends
ETF Industry KPIs 6/29/2026
This week’s KPI data overview highlights key metrics and trends shaping the ETF landscape:
ETF Trends
ETF Industry KPIs June 22, 2026
The ETF Industry saw 40 New Launches and 23 closures last week.
Browse all educational columns

The ETF Industry Is Evolving Fast
From AI infrastructure to active strategies, the ETF landscape is shifting. Share your perspective in the 7th Annual Global ETF Survey and get exclusive early access to the final report.
