ETF model portfolios designed for real investor needs. Discover →



Dow Jones Industrial Average ETFs: Are they worth it?
Is it worth investing in the Dow versus the S&P 500 or Nasdaq 100?


Keep up with what matters in ETFs
Get timely ETF insights, market trends, and top ideas straight to your inbox.
Your newsletter subscriptions with us are subject to ETF Central's Privacy Policy and Terms and Conditions.
I consider myself fairly well-read in the ETF space, so imagine my surprise (and shame) when I realized earlier this month that there were actually products tracking the Dow Jones Industrial Average (DJIA).
I mean, who even invests in the DJIA anymore? It might be the oldest stock market index still around in America, but it's been superseded by the S&P 500 and NASDAQ 100, both of which have hundreds of funds with trillions in assets under management (AUM).
Still, I never shy away from learning, so join me today as I delve deeper into the world of DJIA ETF products and examine their use cases, benefits, and risks.
Like what you're reading?
Stay in the loop — get the latest ETF insights: trends, analysis, and expert picks.
What is the DJIA anyways?
According to S&P Global, the DJIA is a price-weighted index of 30 large-cap, blue-chip U.S. stocks. It originally started in 1896 comprised of just nine railroad stocks and two industrial stocks. Let's break down what this means today:
- Price weighted: Companies are allocated weights according to how high their stock price is. This means for the DJIA, a company like UnitedHealth Group (UNH) is the top holding because its stock price is the highest among its 29 other peers. Compare this to a market cap-weighted index like the S&P 500 where Apple (AAPL) is the top holding due to having the largest market capitalization (share price x shares outstanding).
- Blue-chip: The DJIA holds 30 NYSE trading stocks considered to be leaders in their respective stock market sectors. Constituents must be large-cap (more than $10 billion in market cap) and be profitable.
Most professionals consider the DJIA to be an incomplete picture of stock market performance compared to newer indexes like the S&P 500, mostly due to its arbitrary price-weighted performance and limited sampling of companies.
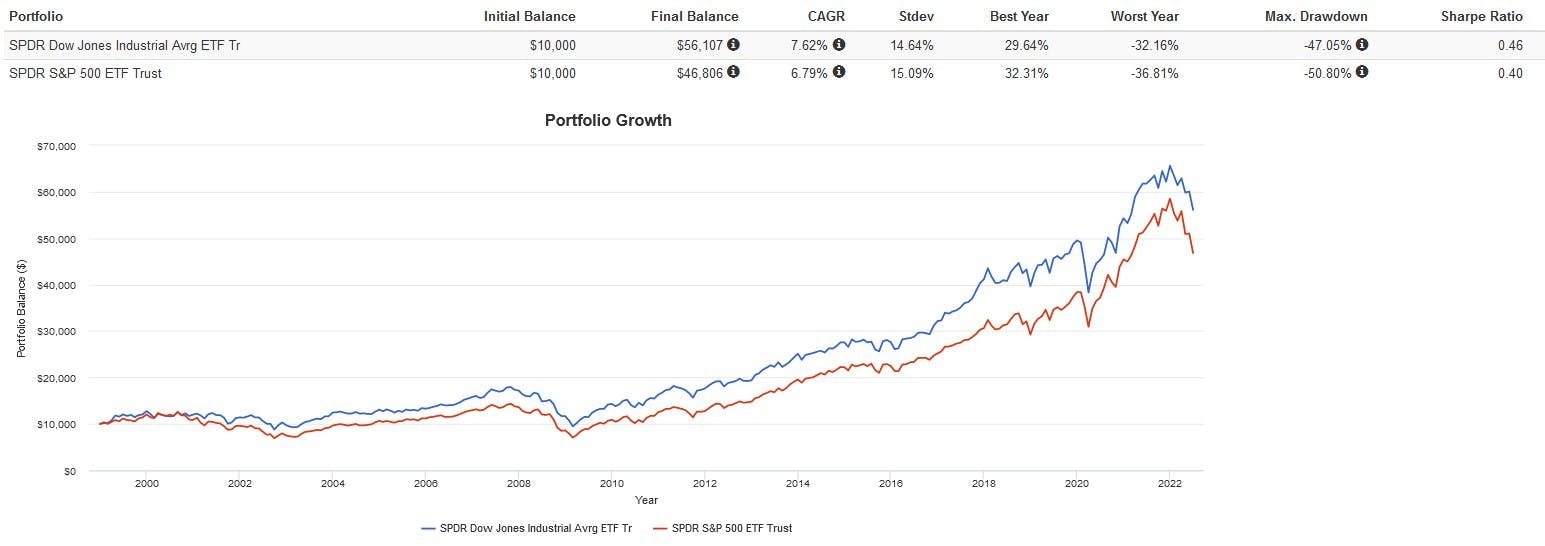
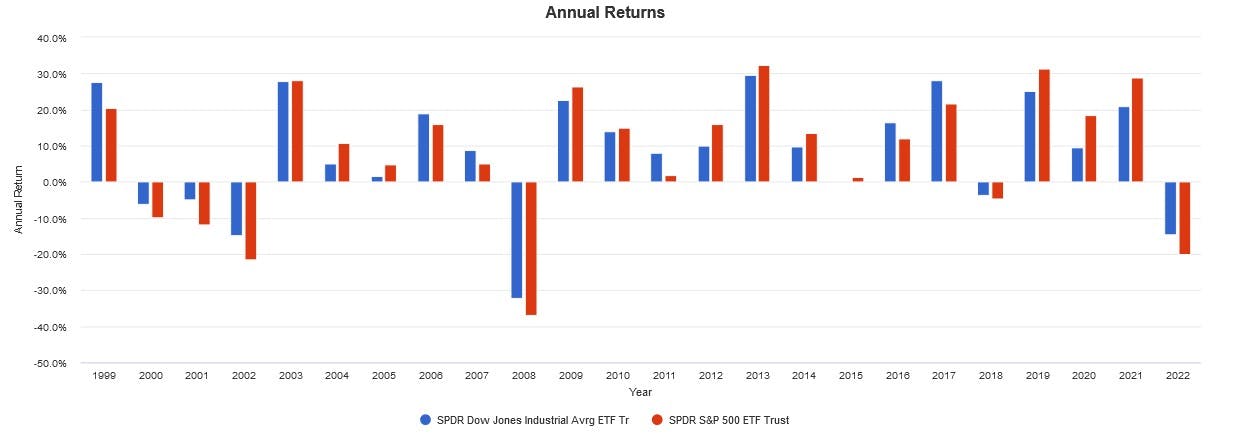
Despite this, the DJIA tracks the S&P 500 well with a high correlation. In general, the DJIA tends to be more defensive, suffering less in bear markets and underperforming in bull markets. Check out this backtest from 1999 to present:
ETF options
Investors looking for a "vanilla" buy-and-hold approach to investing in the DJIA have the following options:
- SPDR Dow Jones Industrial Average ETF Trust (DIA): 0.16% expense ratio, $27 billion AUM.
- First Trust Dow 30 Equal Weight ETF (EDOW): 0.50% expense ratio, $122 million AUM.
Of the two, DIA is the most "accurate" replication of the DJIA. However, I find EDOW far more interesting. The equal-weight methodology gets around the often-questioned price-weighted methodology. However, the 0.50% expense ratio is pricy and hard to stomach.
Funny enough, both EDOW and DIA give good exposure to the quality, investment, and value risk factors given their concentrated holding of 30 blue-chip stocks. They also have a decent dividend yield, which may be preferable to income investors. Here's how they've performed head-to-head since 2018:
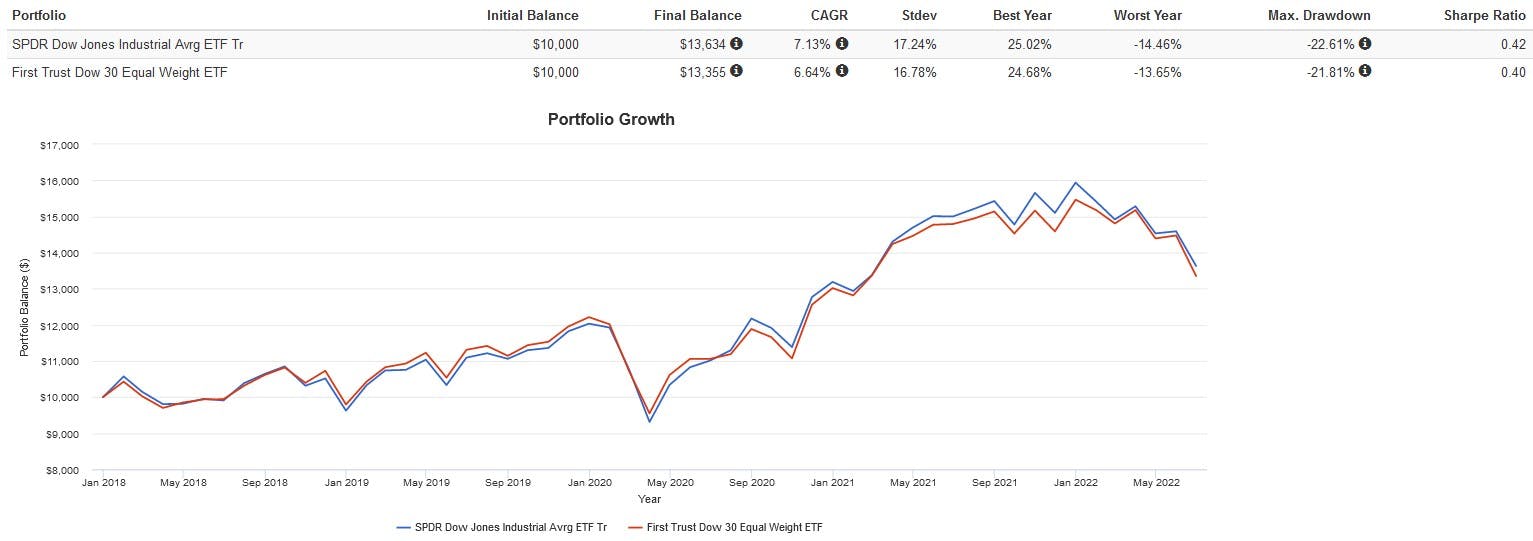

The results are surprising. I expected EDOW to perform better, but DIA has outperformed. Maybe the price-weighted methodology isn’t that bad after all.
Investors looking for leveraged exposure can also use the following ProShares ETFs. As disclosed in their prospectus, these ETFs are not intended for a long-term hold, and are best suited for day or swing-traders looking for an alternative to margin, options, or futures:
- ProShares Ultra DOW30 ETF (DDM): 0.96% expense ratio, $361 million AUM, 2x daily reset leveraged exposure.
- ProShares UltraPro DOW30 ETF (UDOW): 0.95% expense ratio, $588 million AUM, 3x daily reset leverage.
The final word on DJIA ETFs
I think the lower AUM of these products is telling of their popularity. There's no real reason (in my opinion) to pick a product like DIA over an S&P 500 ETF like the SPDR S&P 500 ETF (SPY), given the latter's massive AUM, minuscule bid-ask spread, lower expense ratio, and well-developed options chain. If you really wanted to hold a basket of 30 blue-chip U.S. stocks, you could skip the expense ratio and buy them yourself on a zero-commission brokerage.
Latest ETF News
See all ETF newsCould Water ETFs Be the Next AI Bottleneck Trade?

What is a Boomer Candy ETF?

ETF Comparison: NEOS Nasdaq-100 High Income ETF (QQQI) Versus Goldman Sachs Nasdaq-100 Premium Income ETF (GPIQ)





 Advantages of ETFs over Mutual Funds1/6
Lower Costs
In this guide, we'll explore the advantages of ETFs over mutual funds, giving you valuable insights into why ETFs have gained significant popularity among investors like yourself.
Leveraged ETFs: Unlocking the Potential for Amplified Returns1/6
Understanding Leveraged ETFs
Explore leveraged ETFs: potential for amplified returns & risks. 5 ETFs to consider across equities, commodities & fixed income.
What is a Leveraged ETF?1/6
Introducing Leveraged and Inverse ETFs
In this guide, we'll dive into the world of leveraged ETFs, exploring their definition, mechanics, potential risks, and rewards.
Recent educational content

ETF Trends
ETF Industry KPIs September 8, 2026
This week’s KPI data overview highlights key metrics and trends shaping the ETF landscape.

ETF Trends
ETF Industry KPIs August 31, 2026
This week’s KPI data overview highlights key metrics and trends shaping the ETF landscape.
ETF Trends
ETF Industry KPIs August 24, 2026
This week’s KPI data overview highlights key metrics and trends shaping the ETF landscape.
What’sTheFund
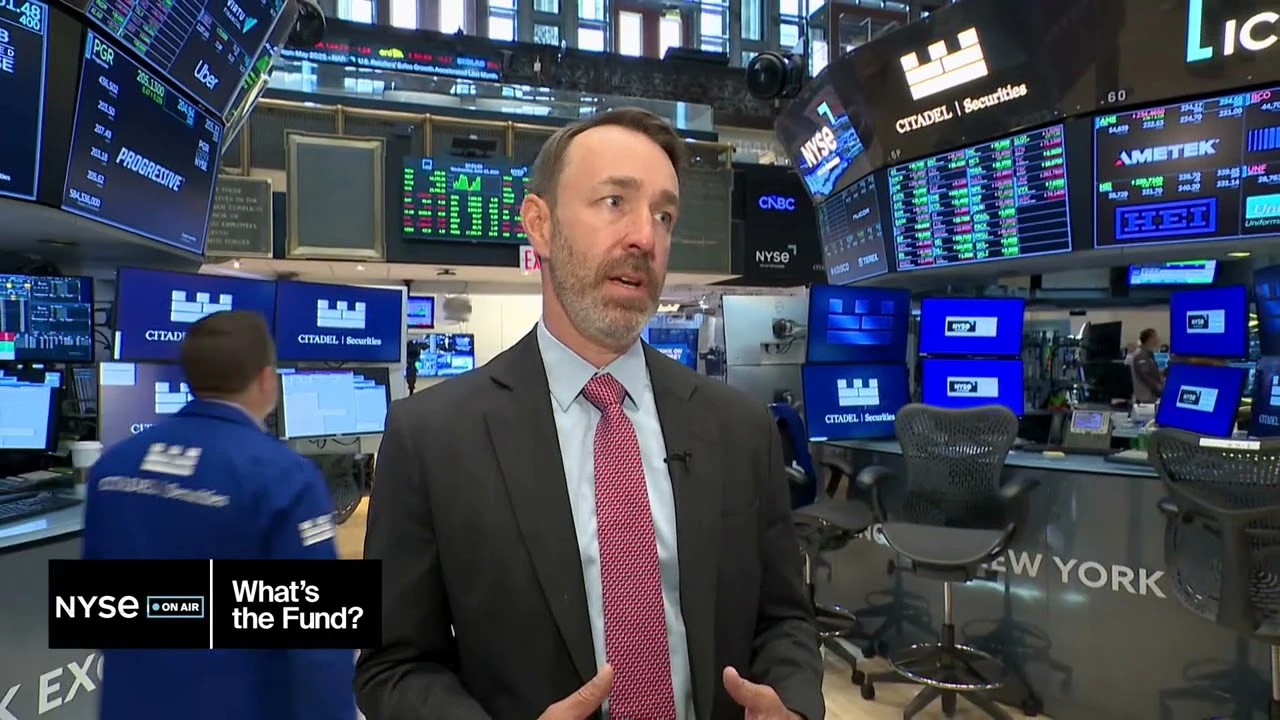
What's the Fund | Ocean Park Diversified Income ETF (DUKZ)
James St Aubin, Chief Investment Officer at Ocean Park Asset Management, discuss the DUKZ ETF, exposing investors to the whole spectrum of asset classes in the fixed income markets, through their rules-based process.

Browse all educational columns



Expert-Built ETF Portfolios, All in One Place
Don’t start from scratch. Discover ready-made ETF portfolios built by professionals to match different goals, timelines, and market views. Use them as inspiration or as a starting point for your own allocation.