Open Now: The Global ETF Survey Take the Survey →

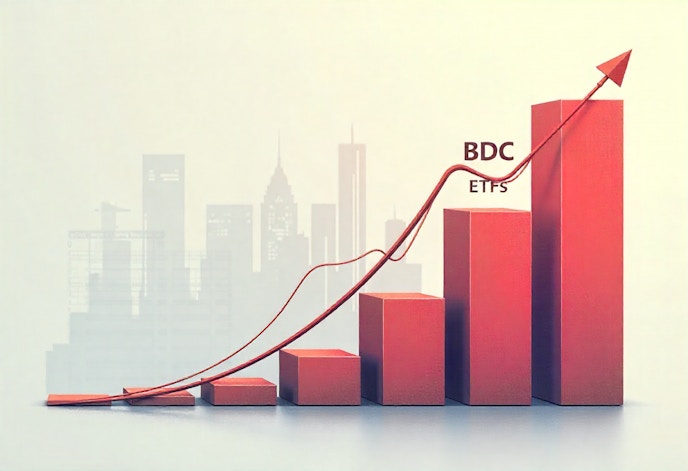
Business Development Company (BDC) ETFs Slide as Private Credit Risks Weigh on Investor Sentiment
BDC ETFs are under pressure in 2025 amid growing concerns over potential losses and contagion in private credit markets.

Keep up with what matters in ETFs
Get timely ETF insights, market trends, and top ideas straight to your inbox.
Your newsletter subscriptions with us are subject to ETF Central's Privacy Policy and Terms and Conditions.
JPMorgan CEO Jamie Dimon recently warned of “cockroaches” when it came to the private credit market. His point was simple: when you see one problem loan blow up in private credit, you should assume there are more you haven’t seen yet.
He made that comment after two high-profile failures — subprime auto lender Tricolor and auto parts maker First Brands — both of which collapsed and left banks and private credit lenders with losses, investigations, and questions about underwriting standards.
JPMorgan disclosed about $170 million in losses tied to Tricolor, and while it had no direct exposure to First Brands, Dimon warned that after a decade-plus of easy credit, more weak loans are likely to surface as the cycle turns.
The Department of Justice is also looking into allegations that billions went missing at First Brands, and regulators in both the U.S. and U.K. have started to flag private credit as an area where oversight may lag the speed of growth
The natural reaction has been to examine the new breed of products trying to package private credit inside an ETF, either by tucking up to 15% in illiquid assets or by using collateralized loan obligations, or CLOs, to engineer higher yield.
However, I’m more interested in an established public-market proxy for private credit risk: business development companies, or BDCs. This makes it worth revisiting a quieter corner of the ETF market.
Like what you're reading?
Stay in the loop — get the latest ETF insights: trends, analysis, and expert picks.
Why BDCs are noteworthy right now
A BDC is a pass-through lending vehicle. It does not pay corporate income tax as long as it distributes most of its earnings. In exchange, it lends money directly to middle-market private companies, mostly through senior, first-lien, floating-rate loans.
In plain English, BDCs behave like direct lenders. They earn high interest from borrowers that can’t tap traditional bond markets, and then pay that cash out to shareholders, often monthly or quarterly, at yields that can reach well into the teens.
Here is the problem. BDC ETFs — which bundle baskets of these lenders — have been weak year-to-date. Part of that is sentiment. Investors are starting to ask whether stress in private credit could spill over into BDC loan books. Some BDCs are trading at steeper-than-normal discounts to their reported net asset value (NAV), which tells you the market doesn’t fully believe the marks on those loans.
You’re also seeing concern around aggressive practices like payment-in-kind, or PIK, where a borrower “pays” interest by adding more debt instead of sending cash. That props up stated yields in the short term, but it’s also a sign that the borrower is strained.
In short, leverage levels inside some BDCs, sector concentration in cyclical industries, and the lack of transparency around workout recoveries are all being watched more closely now.
Active versus passive BDC ETFs
BDC ETFs have become popular with yield-focused investors thanks to their eye-catching income potential. There are only two notable options in this space, and both are down year to date, but how they’re built makes a significant difference in long-term results.
First up is the VanEck BDC Income ETF
I’m not a fan of this approach. Market cap weighting may work fine for traditional equities, where larger firms often have more diversified earnings, but in BDCs, size doesn’t necessarily reflect portfolio quality.
A large BDC might be heavily levered, concentrated in cyclical loans, or more aggressive in marking its assets, while smaller ones can be better managed and more conservative. In short, market cap is a poor proxy for credit discipline.
Performance-wise, BIZD hasn’t been weak. It currently pays a 9.14% 30-day SEC yield and has posted a 15.54% annualized total return over the past three years. However, its 12.86% expense ratio looks alarming at first glance—but that figure is misleading.
Under a 2006 SEC rule for “funds of funds,” ETFs like BIZD must report acquired fund fees and expenses (AFFEs), which represent the fees charged by the underlying BDCs in which the ETF invests. These are indirect expenses, not costs paid directly by the ETF itself. In practice, investors don’t actually bear a 12% annual fee drag, and those AFFEs don’t show up in the fund’s financial statements.
The more thoughtful alternative, in my view, is the Putnam BDC Income ETF
Instead of simply ranking BDCs by size, portfolio manager Mike Petro evaluates each holding using more fundamental metrics—things like non-accrual rates, portfolio yield on cost, net investment income (NII) growth, leverage ratios, and management fee alignment. These are the same factors institutional analysts use when grading BDC quality.
Because the investable BDC universe is relatively small, PBDC’s holdings overlap significantly with BIZD’s. Even so, since its launch, the fund has consistently added value through active positioning. Over the same three-year period, PBDC delivered an 18.74% total return, outperforming both BIZD’s 15.54% and the S&P BDC Index’s 16.18%, while maintaining a comparable 9.81% 30-day SEC yield.
I think for investors seeking BDC exposure, PBDC shows that active management can still make a difference—especially in a niche corner of the market where quality, discipline, and portfolio construction matter more than sheer size.
Please note that this article reflects the author’s personal views and does not represent the opinions of the publication or its affiliates. It is for informational purposes only and does not constitute investment advice. It is essential to seek guidance from a registered financial professional before making any investment decisions.


Latest ETF News
See all ETF newsHow Investors can Maximize Tax Efficiency with Income ETFs

Trump Accounts: Here's Which ETFs You Can Invest In

The Two Best Types of Fixed-Income ETFs For Managing Cash

ETF Comparison: Roundhill Generative AI & Technology ETF Versus iShares A.I. Innovation and Tech Active ETF


 Advantages of ETFs over Mutual Funds1/6
Lower Costs
In this guide, we'll explore the advantages of ETFs over mutual funds, giving you valuable insights into why ETFs have gained significant popularity among investors like yourself.
Leveraged ETFs: Unlocking the Potential for Amplified Returns1/6
Understanding Leveraged ETFs
Explore leveraged ETFs: potential for amplified returns & risks. 5 ETFs to consider across equities, commodities & fixed income.
What is a Leveraged ETF?1/6
Introducing Leveraged and Inverse ETFs
In this guide, we'll dive into the world of leveraged ETFs, exploring their definition, mechanics, potential risks, and rewards.
Recent educational content

ETF Trends
ETF Industry KPIs July 20, 2026
This week’s KPI data overview highlights key metrics and trends shaping the ETF landscape.
ETF Trends
ETF Industry KPIs July 13, 2026
This week’s KPI data overview highlights key metrics and trends shaping the ETF landscape.

First Look ETF
First Look ETF: Cash Deployment, Bond, and Hedged ETFs
In this season 6 episode of First Look ETF, Stephanie Stanton examines the latest ETF marketplace trends with NYSE and guests.

ETF Trends
ETF Industry KPIs July 6, 2026
This week’s KPI data overview highlights key metrics and trends shaping the ETF landscape.
Browse all educational columns

Active Trader Report: Use of Leveraged & Inverse ETFs Way Up
Direxion partnered with Compound Insights and Vanda to explore what’s driving the evolution of active trading — and how active traders are using leveraged and inverse funds across equities, single stocks, commodities, and volatility.
