Open Now: The Global ETF Survey Take the Survey →



Avoid S&P 500 Concentration Risk with These Two ETFs
Like the S&P 500 index, but hate how top-heavy and tech focused it has become? These two ETFs use alternate weighting schemes to provide better balance.


Keep up with what matters in ETFs
Get timely ETF insights, market trends, and top ideas straight to your inbox.
Your newsletter subscriptions with us are subject to ETF Central's Privacy Policy and Terms and Conditions.
The S&P 500 remains one of the best equity benchmarks ever created, but that doesn't mean it's without flaws. As the largest companies have continued to outperform over the past decade, the index has become increasingly concentrated. I think there are three ways that risk is most evident today.
First is simply how top-heavy the benchmark has become. The 10 largest holdings now account for roughly 38% of the entire index, meaning a relatively small handful of companies have an outsized influence on performance.
Sector concentration is another concern.
Information technology alone represents approximately 37% of the index.
Arguably, that even understates investors' true exposure to technology, since many businesses commonly viewed as tech companies are classified under communication services and consumer discretionary, which account for roughly another 10% and 9% of the benchmark, respectively.
Finally, there is a pronounced growth tilt.
The S&P 500 currently trades at a trailing price-to-book ratio of 5.7 times and a trailing price-to-earnings ratio of 30.5 times, reflecting investors' willingness to pay premium valuations for many of its largest constituents.
Personally, I still think these trade-offs are acceptable for many investors.
The S&P 500 remains extremely inexpensive to track via passive ETFs, highly tax efficient because of its relatively low turnover, and market-cap weighting has a major advantage: it naturally lets winning companies run.
That momentum characteristic has been a significant contributor to the index's long-term success.
The downside is that, late in a market cycle, those same winners can grow so dominant that concentration risk becomes difficult to ignore.
If you're still looking for U.S. large-cap equity exposure but aren't interested in paying for active management, there are several smart beta alternatives that keep the familiar S&P 500 universe while changing how the stocks are weighted.
You still benefit from the index's liquidity, size, profitability requirements, and constituent selection process, but without relying solely on market-cap weighting.
Today, we'll look at two approaches: an equal-weight strategy from Invesco and a historical-weighting methodology from Tema ETFs.
The ETF Industry Is Evolving Fast
From AI infrastructure to active strategies, the ETF landscape is shifting. Share your perspective in the 7th Annual Global ETF Survey and get exclusive early access to the final report.
Invesco S&P 500 Equal Weight ETF (RSP)
The Invesco S&P 500 Equal Weight ETF
Its sector allocations look very different from the traditional benchmark. Technology accounts for roughly 15% of the portfolio, less than half of the weighting in the standard S&P 500, while industrials and financials each represent approximately 16% and 15%, respectively. Those sector weights will naturally evolve over time as quarterly rebalancing takes place.
The biggest advantage of this approach is that it introduces a systematic buy-low, sell-high discipline. As stocks outperform and become overweight, the ETF trims those positions back to their target weights. Likewise, companies that have lagged are topped back up during each quarterly rebalance.
The downside is that this can become a headwind during strong bull markets. As Peter Lynch famously warned, you can end up "trimming the flowers and watering the weeds."
By continuously trimming the market's biggest winners, equal-weight strategies may sacrifice some of the momentum that has historically driven market-cap-weighted indexes.
Its sector allocations look very different from the traditional benchmark. Technology accounts for roughly 15% of the portfolio, less than half of the weighting in the standard S&P 500, while industrials and financials each represent approximately 16% and 15%, respectively. Those sector weights will naturally evolve over time as quarterly rebalancing takes place.
Another drawback is cost. RSP charges a 0.20% expense ratio, more than ten times higher than the 0.02% charged by the State Street SPDR Portfolio S&P 500 ETF (SPYM). The higher turnover required to maintain equal weights inevitably makes the strategy more expensive to operate.
Fortunately, RSP has been around long enough to evaluate over a full market cycle.
From April 30, 2003 through July 15, 2026, the ETF delivered an annualized return of 11.26%, slightly trailing the 11.52% annualized return of the SPDR S&P 500 ETF Trust (SPY). RSP also experienced deeper maximum drawdowns and higher annualized volatility over that period, resulting in a lower Sharpe ratio of 0.55 compared with 0.59 for SPY.
Source: Testfolio
When RSP does outperform, it is often because the size factor comes back into favor.
The ETF naturally allocates far more to mid-caps. Today, however, I think there are cleaner ways to express that view. With inexpensive small-cap factor ETFs readily available, investors can target the size premium more directly instead of relying on the indirect exposure created by an equal-weight methodology.
One final advantage is that, despite the strategy's relatively high turnover, investors generally don't have to worry about the large taxable capital gains distributions often associated with equal-weight mutual funds. Thanks to the ETF creation and redemption mechanism, much of that turnover can occur in-kind, helping preserve tax efficiency.
Tema S&P 500 Historical Weight ETF (DSPY)
Investors looking for a more sophisticated approach to reducing S&P 500 concentration risk may find the Tema S&P 500 Historical Weight ETF
Rather than assuming every company deserves an identical allocation regardless of its size, the ETF asks what a more typical representation of each company has been over time and gradually moves the portfolio back toward those historical norms.
DSPY is also slightly cheaper than RSP, charging a 0.18% expense ratio. Since launching in April 2025, it has attracted just under $1 billion in assets under management, suggesting investors have shown meaningful interest in the concept.
The resulting portfolio remains familiar to anyone accustomed to the S&P 500, but with noticeably better balance. Technology is still the largest sector at roughly 29%, significantly below its weighting in the traditional market-cap-weighted index. Financials account for approximately 15% of the portfolio, while industrials and health care each represent about 11%.
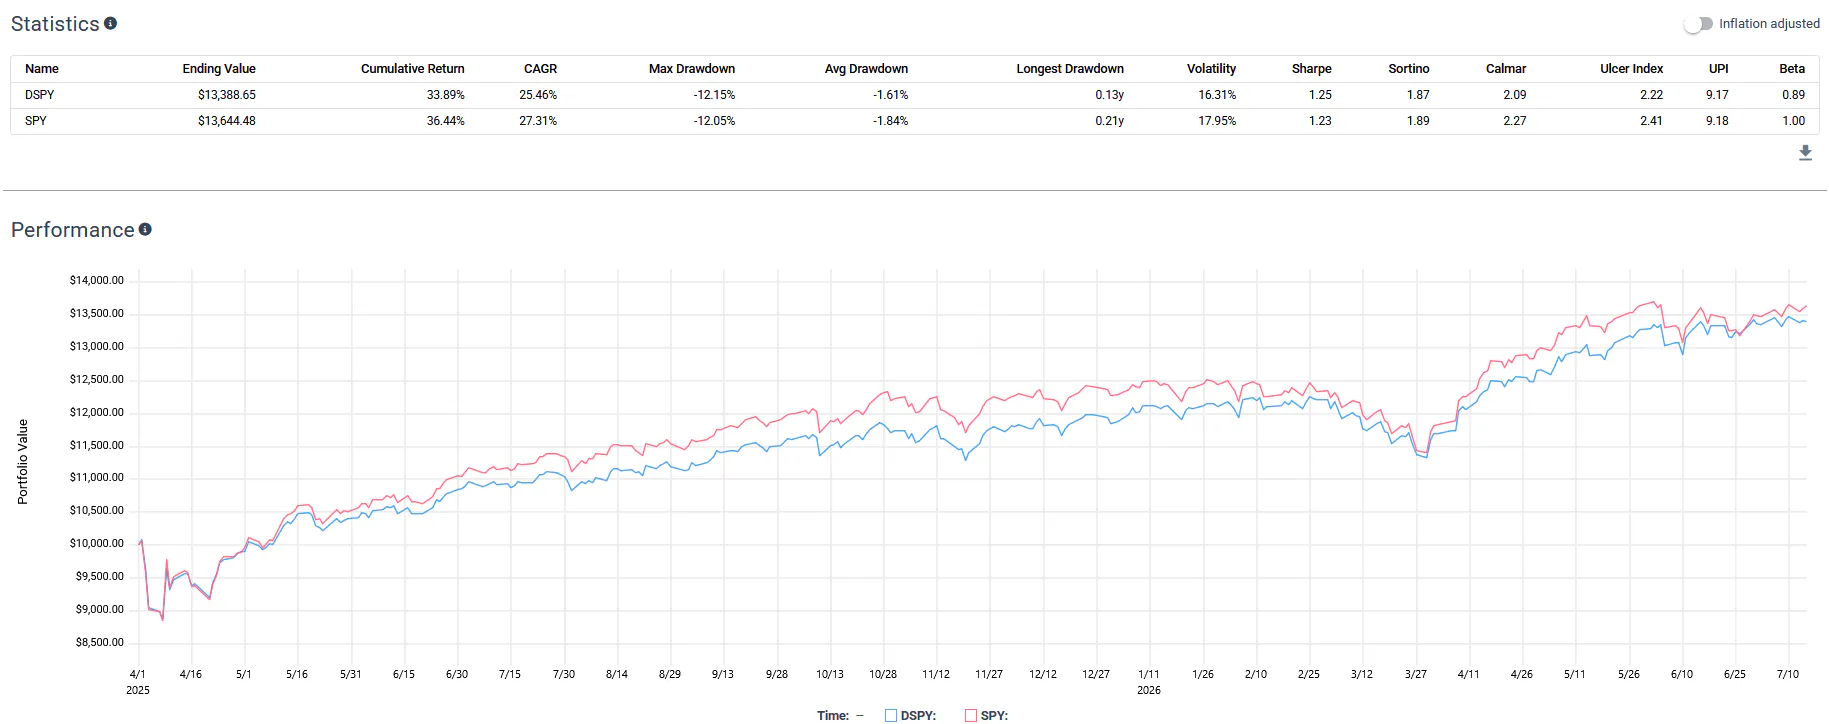
Because DSPY is still a relatively new ETF, performance data remain limited. That being said, from April 1, 2025, through July 15, 2026, the fund generated a 26.46% annualized return compared with 27.31% for SPY. Despite the slight performance lag, DSPY exhibited lower volatility, resulting in a marginally better Sharpe ratio of 1.25 versus 1.23.
Source: Testfolio
Personally, this is the approach I prefer over equal weighting. It addresses concentration risk without abandoning the economic intuition behind market-cap weighting. There is no fundamental reason that Apple should receive the exact same allocation as the smallest company in the S&P 500.
A historical-weighting methodology still acknowledges that larger companies deserve larger allocations because of their economic importance, but it avoids allowing a handful of recent winners to dominate the portfolio simply because their market capitalizations have expanded dramatically over a short period.
Please note this article is for information purposes only and does not in any way constitute investment advice. It is essential that you seek advice from a registered financial professional prior to making any investment decision.


Latest ETF News
See all ETF newsHow Investors can Maximize Tax Efficiency with Income ETFs

Trump Accounts: Here's Which ETFs You Can Invest In

The Two Best Types of Fixed-Income ETFs For Managing Cash

ETF Comparison: Roundhill Generative AI & Technology ETF Versus iShares A.I. Innovation and Tech Active ETF




 Advantages of ETFs over Mutual Funds1/6
Lower Costs
In this guide, we'll explore the advantages of ETFs over mutual funds, giving you valuable insights into why ETFs have gained significant popularity among investors like yourself.
Leveraged ETFs: Unlocking the Potential for Amplified Returns1/6
Understanding Leveraged ETFs
Explore leveraged ETFs: potential for amplified returns & risks. 5 ETFs to consider across equities, commodities & fixed income.
What is a Leveraged ETF?1/6
Introducing Leveraged and Inverse ETFs
In this guide, we'll dive into the world of leveraged ETFs, exploring their definition, mechanics, potential risks, and rewards.
Recent educational content

ETF Trends
ETF Industry KPIs July 20, 2026
This week’s KPI data overview highlights key metrics and trends shaping the ETF landscape.

ETF Trends
ETF Industry KPIs July 13, 2026
This week’s KPI data overview highlights key metrics and trends shaping the ETF landscape.

First Look ETF
First Look ETF: Cash Deployment, Bond, and Hedged ETFs
In this season 6 episode of First Look ETF, Stephanie Stanton examines the latest ETF marketplace trends with NYSE and guests.

ETF Trends
ETF Industry KPIs July 6, 2026
This week’s KPI data overview highlights key metrics and trends shaping the ETF landscape.
Browse all educational columns



Active Trader Report: Use of Leveraged & Inverse ETFs Way Up
Direxion partnered with Compound Insights and Vanda to explore what’s driving the evolution of active trading — and how active traders are using leveraged and inverse funds across equities, single stocks, commodities, and volatility.