Open Now: The Global ETF Survey Take the Survey →

Are Aerospace & Defense ETFs Overbought and Overvalued Right Now?
This thematic segment has experienced strong outperformance and high inflows over the last five years, but is the momentum sustainable?


Keep up with what matters in ETFs
Get timely ETF insights, market trends, and top ideas straight to your inbox.
Your newsletter subscriptions with us are subject to ETF Central's Privacy Policy and Terms and Conditions.
Since the onset of COVID-19, the global geopolitical landscape has been marked by persistent instability, including Russia’s invasion of Ukraine, renewed hostilities between Azerbaijan and Armenia, Myanmar’s ongoing civil war, conflict between Israel and Hamas, sustained tensions between India and Pakistan, and, most recently, direct strikes involving Israel and a U.S.-led coalition targeting Iran.
For investors in aerospace and defense ETFs, this persistent instability has been highly profitable. That’s because defense stocks tend to rally when conflict escalates, as governments ramp up procurement, replenish munitions, and increase military budgets.
From September 29, 2011, through June 30, 2025, the two dominant NYSE-listed ETFs in this category—the Invesco Aerospace & Defense ETF
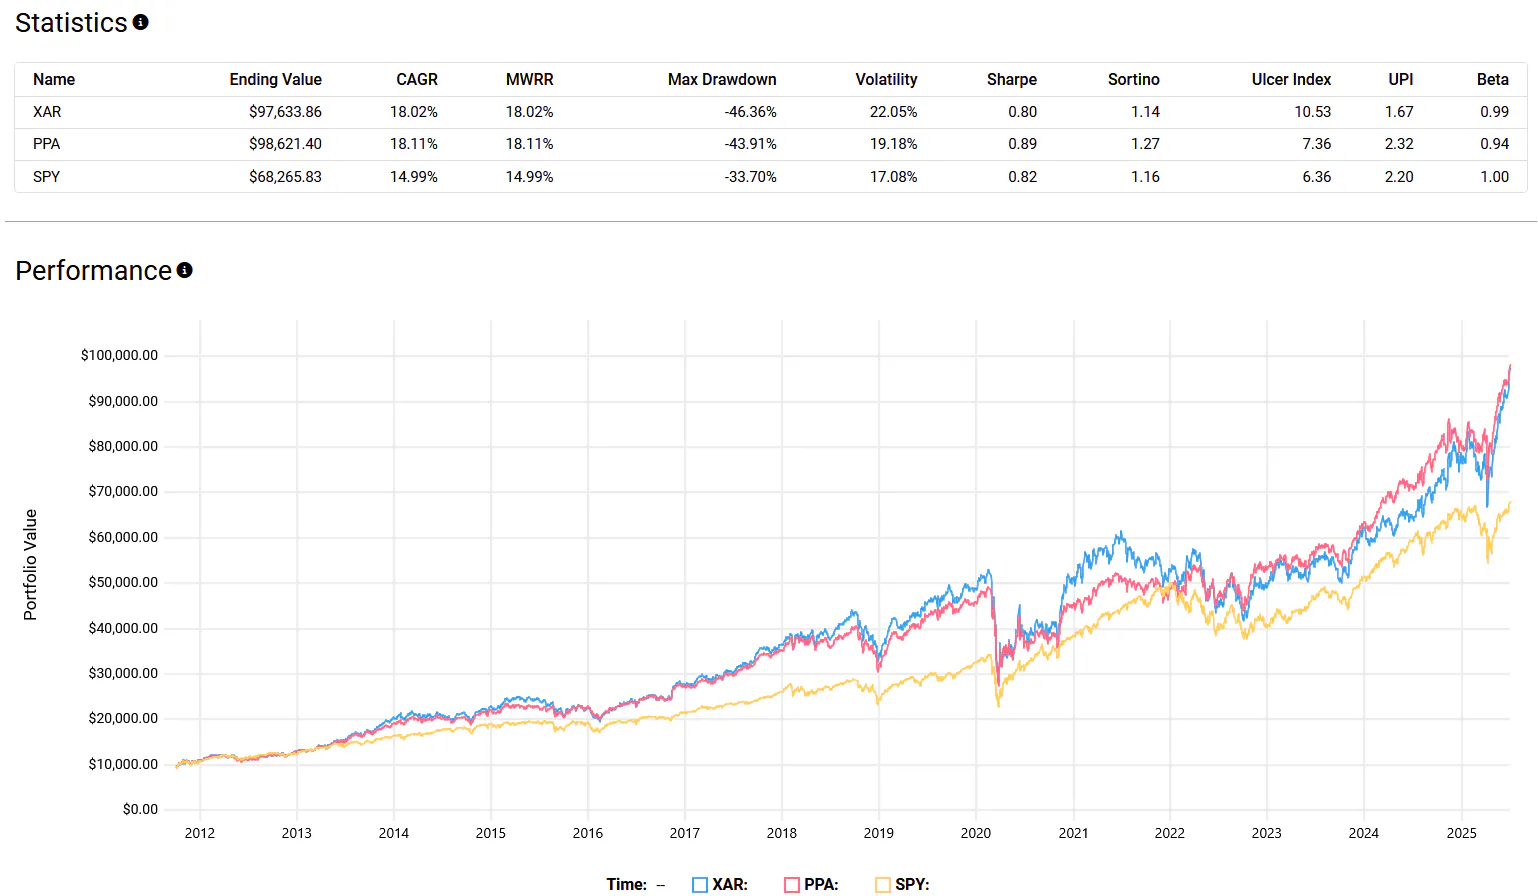
But after years of strong returns and record inflows, some investors are starting to ask: is this trade running out of steam? Are aerospace and defense ETFs overbought and overvalued?
While I’m not a defense analyst and won’t make predictions about future conflicts or policy, what I can do is break down the current fundamentals of these ETFs and offer a bottom-up view on whether the music might be about to stop.
Like what you're reading?
Stay in the loop — get the latest ETF insights: trends, analysis, and expert picks.
Are aerospace & defense ETFs overvalued?
The first chart shows the five-year dividend yield history for PPA and XAR. Both funds are currently yielding under 0.55%, with PPA at 0.46% and XAR at 0.53%.
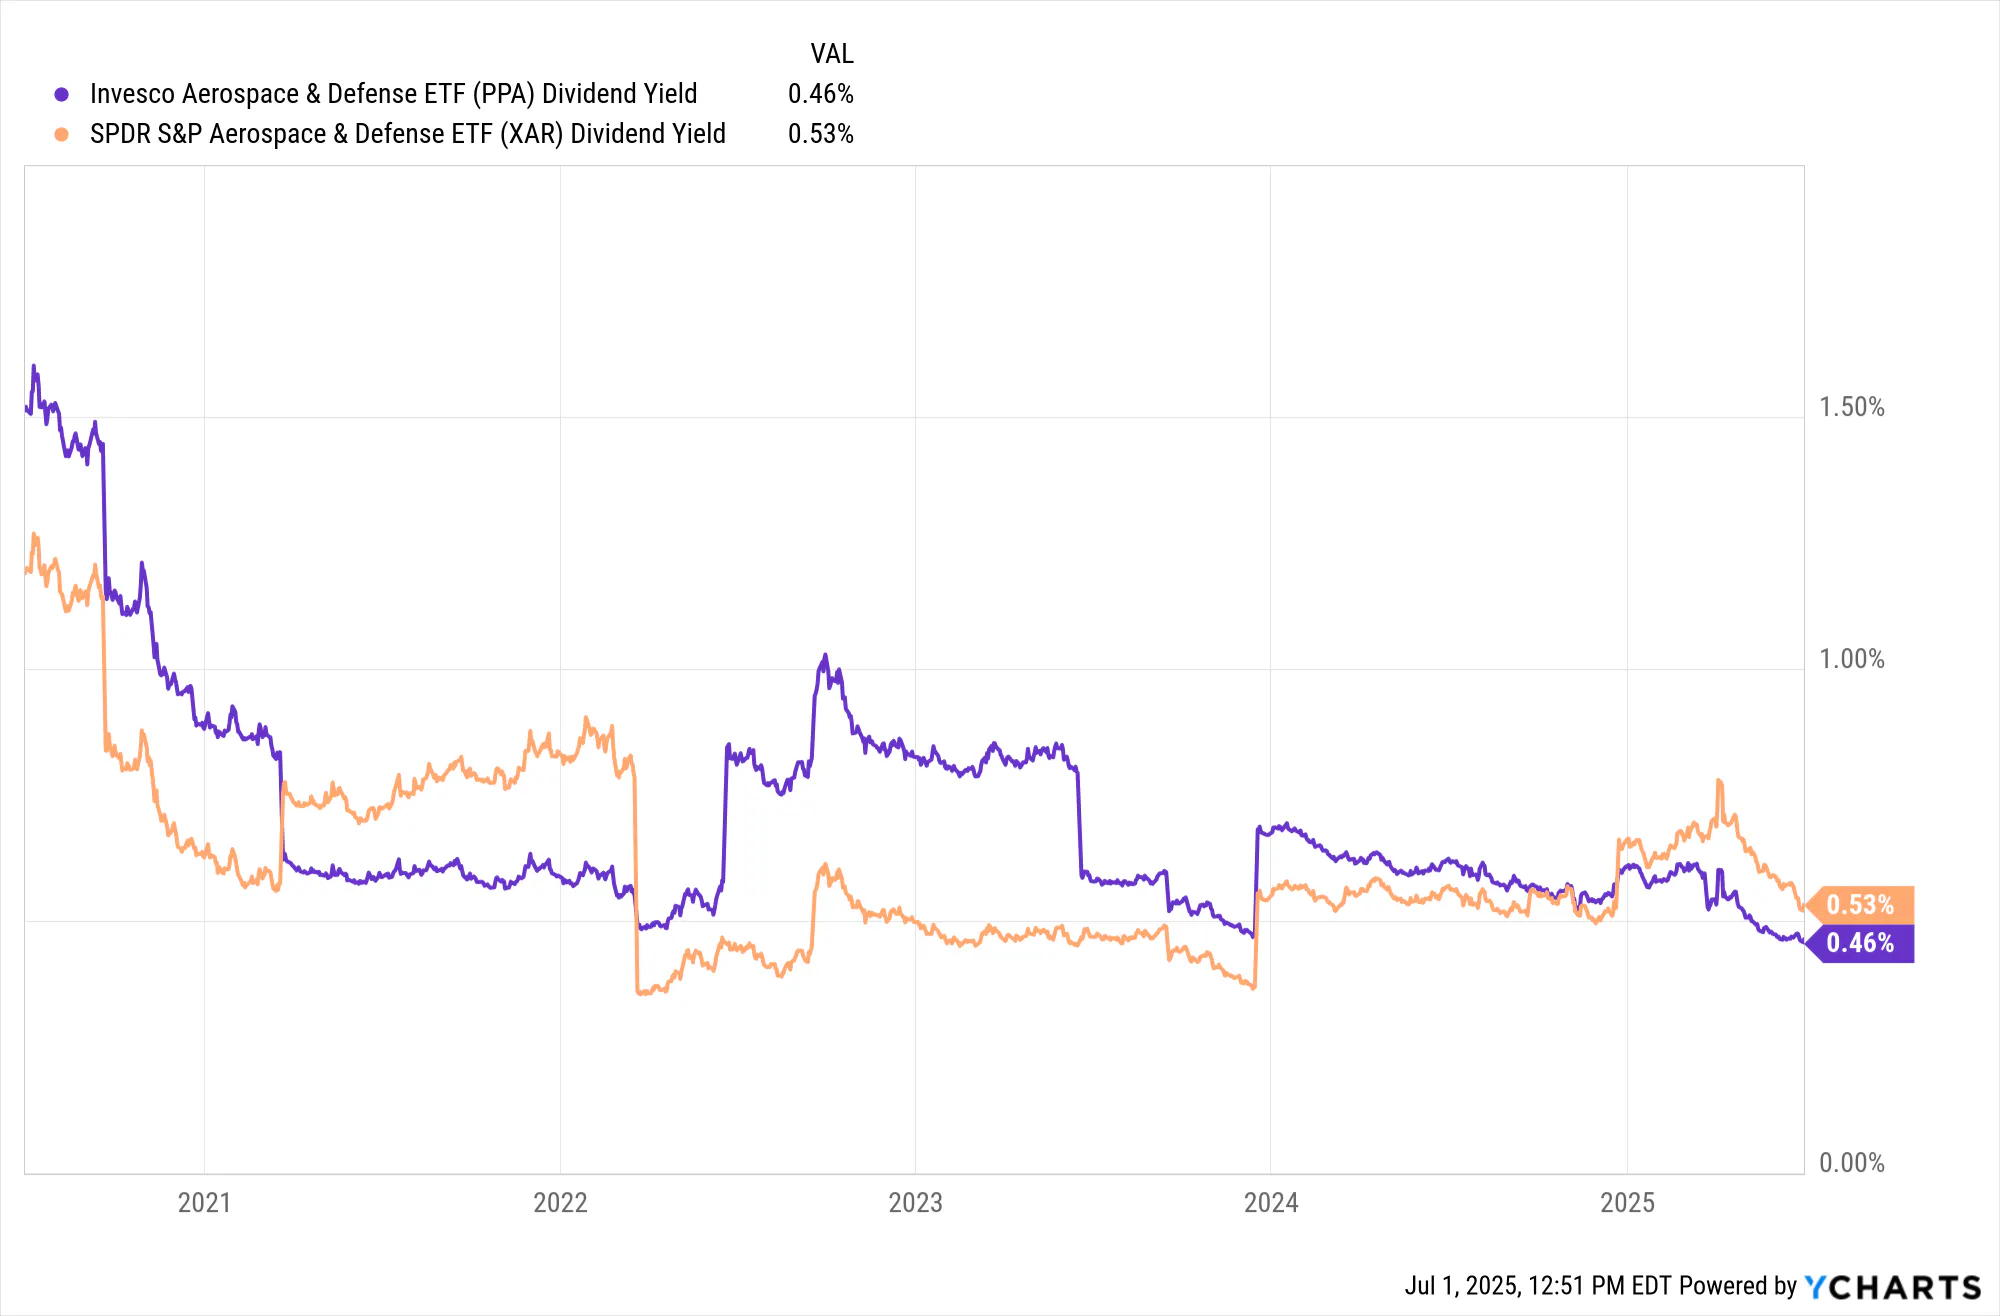
That’s a steep drop from where yields stood five years ago, when both ETFs offered roughly double the income. The chart shows a steady erosion in dividend yield across both funds, with only brief and shallow upticks. For me, that’s a strong signal that price gains have far outpaced dividend growth.
This pattern tends to show up when valuations are expanding faster than fundamentals. When yields fall over time without a corresponding increase in payout ratios, it typically reflects a market bidding up prices, not companies paying more back to shareholders.
While aerospace and defense firms aren’t known for high income anyway, the current levels are notably low even by sector standards. Investors buying in today are locking in much less yield than those who entered even two or three years ago.
The second chart offers a more detailed look under the hood, comparing the free cash flow (FCF) yields of the four largest U.S. prime defense contractors: Lockheed Martin, General Dynamics, RTX, and Northrop Grumman, against the 10-year Treasury yield over the past year.

As of July 2025, Lockheed and General Dynamics show relatively healthy FCF yields of 4.5% and 4.1%, respectively. But RTX and Northrop are hovering closer to 2.5%, a level that suggests investors are paying a premium relative to current cash generation, especially given the current 10-year yield.
What stands out is how all four companies saw their FCF yields compress recently. The decline was sharp and sustained, meaning valuations increased much faster than cash flow growth.
This kind of compression tends to occur when investor optimism runs ahead of company performance. It doesn’t necessarily mean a reversal is imminent, but it does point to reduced upside unless future results accelerate meaningfully.
Together, I think the dividend and free cash flow trends tell a consistent story. While the macro case for defense remains intact, the bottom-up valuation picture suggests most of the easy gains may have already been captured.
Are aerospace & defense ETFs overbought?
It’s important to distinguish between overbought and overvalued. An ETF is considered overvalued when its price exceeds a reasonable estimate of its intrinsic worth based on fundamentals like earnings, free cash flow, or asset value. Overbought, on the other hand, refers to technical conditions, typically when short-term price momentum is extended to a level that may not be sustainable.
In practical terms, long-term investors tend to focus on whether a stock or ETF is overvalued. Traders and shorter-term participants care more about whether something is overbought, because that can influence timing for entry or exit points. So, if you're looking to swing trade aerospace and defense ETFs rather than hold them for years, this section may be more relevant.
The first chart shows the 14-day Relative Strength Index (RSI) for PPA and XAR. Both funds are currently showing RSI values near or above 77, with XAR at 79.76 and PPA at 77.08.

In technical analysis, an RSI above 70 is generally considered overbought. These levels suggest that buying pressure has been elevated over the past two weeks, and that both ETFs may be at risk of short-term pullbacks.
That said, RSI doesn’t predict a reversal. It only signals that recent gains have been strong. An ETF can remain in overbought territory for weeks during periods of strong upward momentum. But for technical traders, current RSI levels would typically trigger caution flags or prompt tighter stop-loss management.
This second chart compares the one-year price history of both ETFs against their 50-day and 200-day simple moving averages (SMAs).
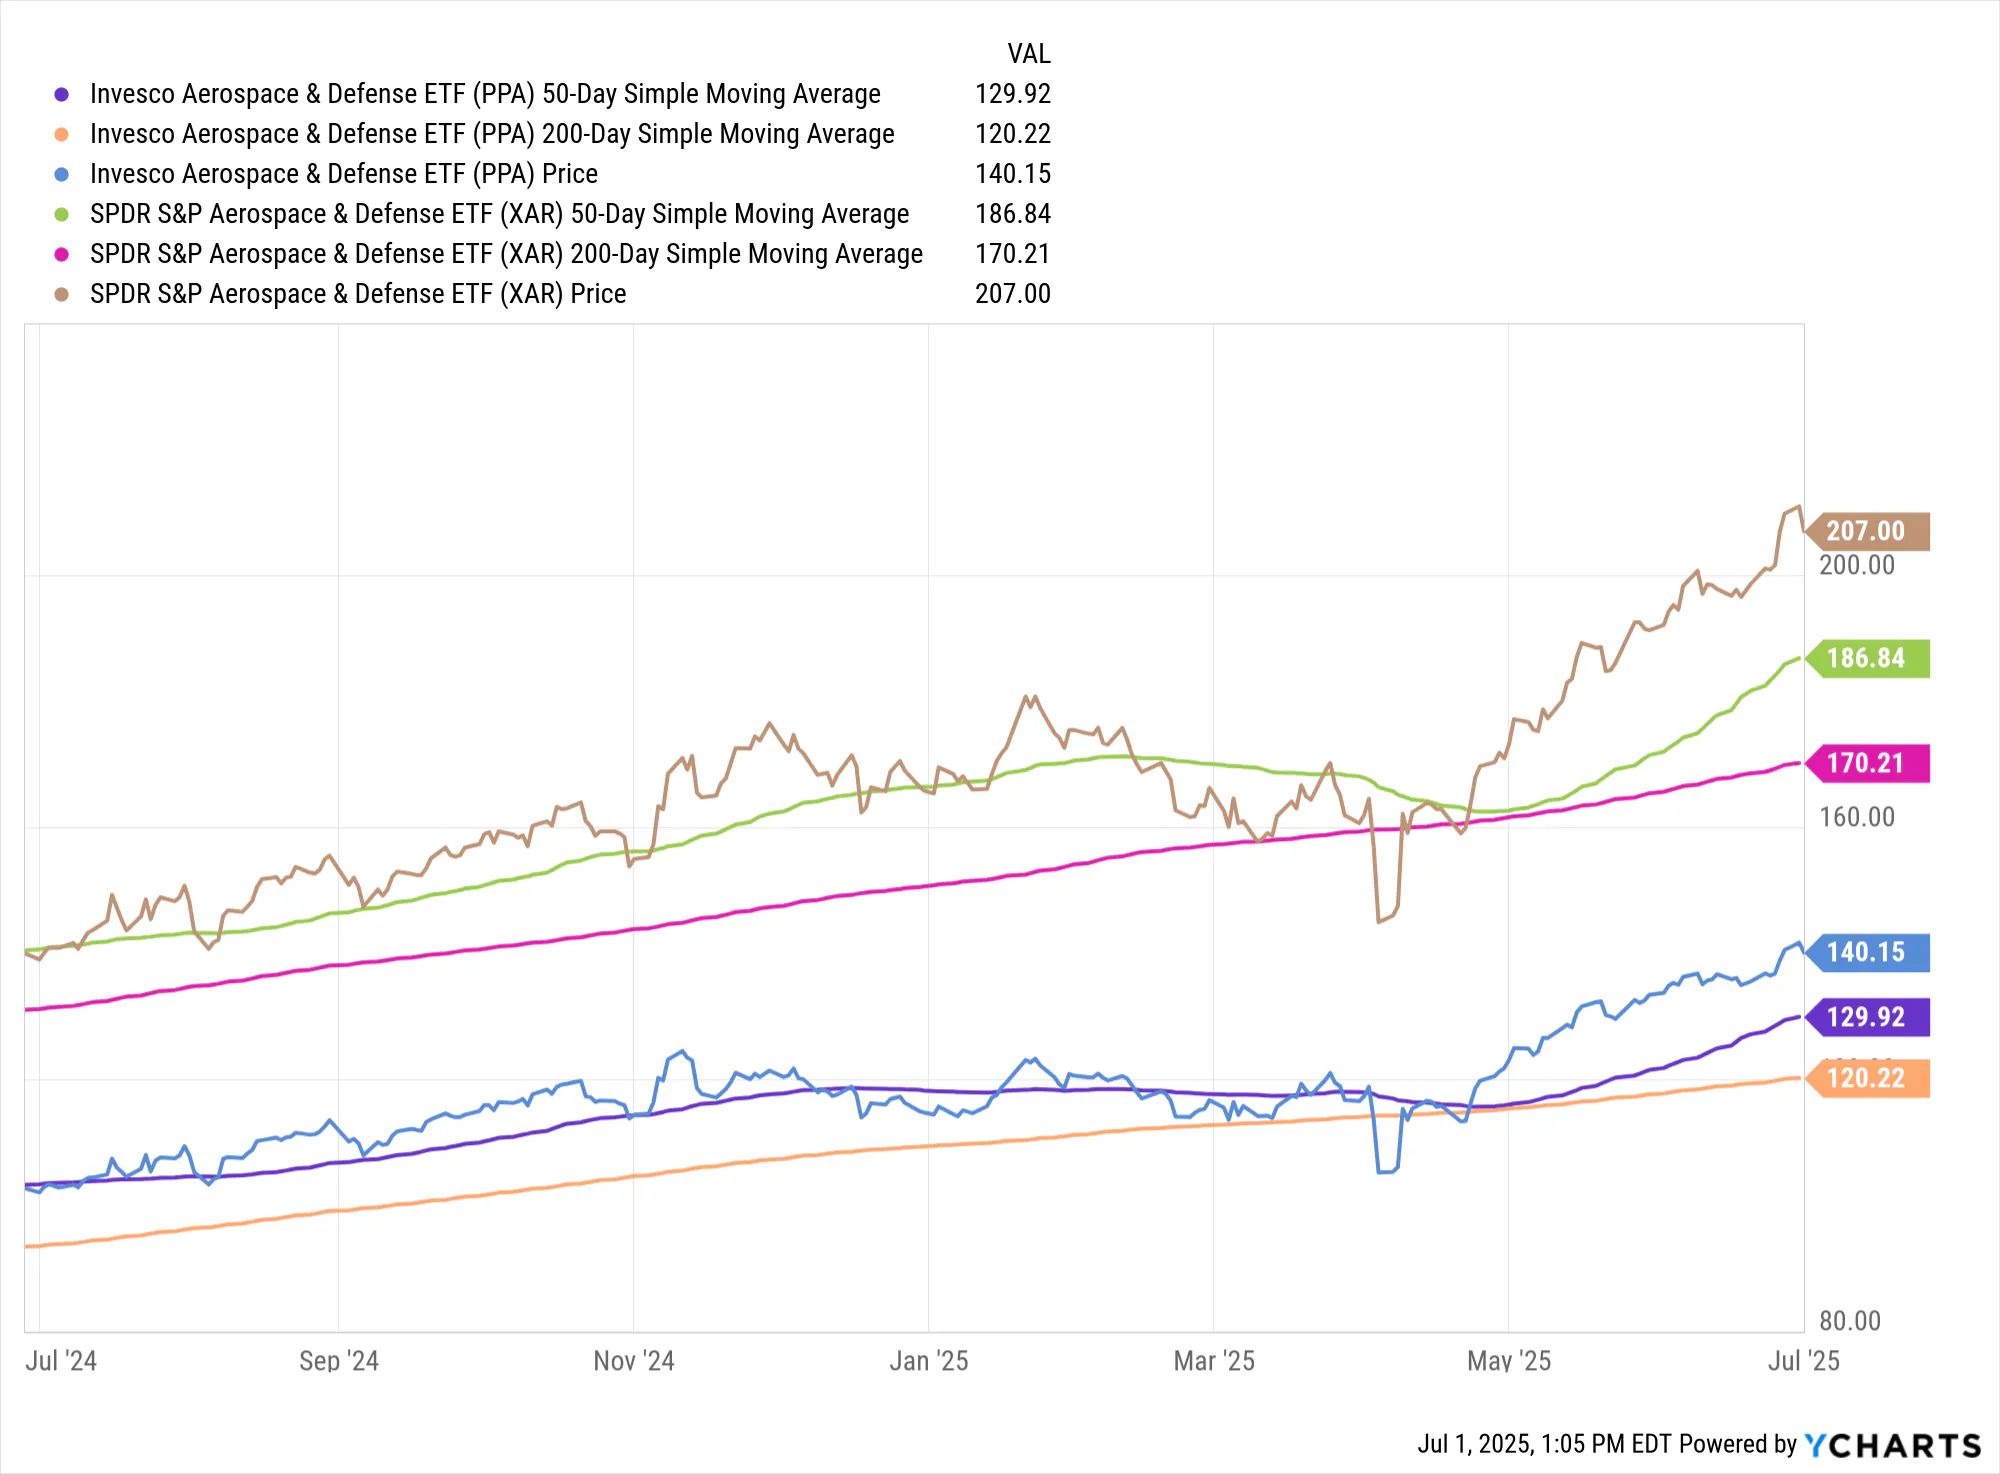
Both XAR and PPA are trading well above their short- and long-term trend lines. XAR is currently at $207, nearly 22% above its 200-day SMA of $170.21 and about 11% above its 50-day SMA of $186.84. PPA shows a similar setup, trading at $140.15 compared to a 200-day average of $120.22 and a 50-day average of $129.92.
From a technical standpoint, this confirms a strong uptrend. But it also highlights that current prices are extended relative to recent trend baselines, particularly in the case of XAR. These kinds of deviations can be resolved through a pullback or consolidation, where the ETF trades sideways while the averages catch up.
I believe both PPA and XAR appear technically overbought at the moment based on RSI and price distance from key moving averages. That doesn’t necessarily mean a crash is imminent, but it does suggest limited short-term upside unless momentum continues accelerating.
Please note that this article reflects the author’s personal views and does not represent the opinions of the publication or its affiliates. It is for informational purposes only and does not constitute investment advice. It is essential to seek guidance from a registered financial professional before making any investment decisions.
Topics
See all
Segments
See all
Mentioned ETFs
Further reading

Latest ETF News
See all ETF newsMoneyShow Chart of the Day 7/1/26: The H1 Scorecard – and What Comes Next

MoneyShow Chart of the Day 6/22/26: Are World Cup Videos Helping US Companies Clean Up?

MoneyShow Chart of the Day 6/3/26: AI. AI. AI. (And a Handful of Other Stocks, Too)

MoneyShow Chart of the Day 5/27/26: SpaceX Hype Sends Space Stocks into Orbit


 Advantages of ETFs over Mutual Funds1/6
Lower Costs
In this guide, we'll explore the advantages of ETFs over mutual funds, giving you valuable insights into why ETFs have gained significant popularity among investors like yourself.
Leveraged ETFs: Unlocking the Potential for Amplified Returns1/6
Understanding Leveraged ETFs
Explore leveraged ETFs: potential for amplified returns & risks. 5 ETFs to consider across equities, commodities & fixed income.
What is a Leveraged ETF?1/6
Introducing Leveraged and Inverse ETFs
In this guide, we'll dive into the world of leveraged ETFs, exploring their definition, mechanics, potential risks, and rewards.
Recent educational content

Asset TV
The ETF Show - The Evolution of Leveraged & Inverse ETFs
Leveraged and inverse ETFs have exploded in popularity over the past decade capturing more assets as retail traders seek to capture volatility.


Asset TV
The ETF Show - Investors Turn to Small Caps as Value Outperforms
After years of outflows, small caps have attracted interest as the Russell 2000 outperforms the broad market. Chris Parker, Senior Portfolio Manager from Thrivent Asset Management joins the ETF Show to discuss.

ETF Trends
ETF Industry KPIs 6/29/2026
This week’s KPI data overview highlights key metrics and trends shaping the ETF landscape:
ETF Trends
ETF Industry KPIs June 22, 2026
The ETF Industry saw 40 New Launches and 23 closures last week.
Browse all educational columns

Expert-Built ETF Portfolios, All in One Place
Don’t start from scratch. Discover ready-made ETF portfolios built by professionals to match different goals, timelines, and market views. Use them as inspiration or as a starting point for your own allocation.
