Turn ETF ideas into real portfolios. Try the builder now →



3 Water ETFs for Thirsty Investors
These niche thematic ETFs can be used to express a bullish view on the U.S. or global water industry.


Keep up with what matters in ETFs
Get timely ETF insights, market trends, and top ideas straight to your inbox.
Your newsletter subscriptions with us are subject to ETF Central's Privacy Policy and Terms and Conditions.
In the critically acclaimed 2015 movie about the 2008 Sub-Prime Mortgage Crisis, "The Big Short," viewers were presented with an ominous message towards the end about Michael Burry's latest "all-in" investment: water.
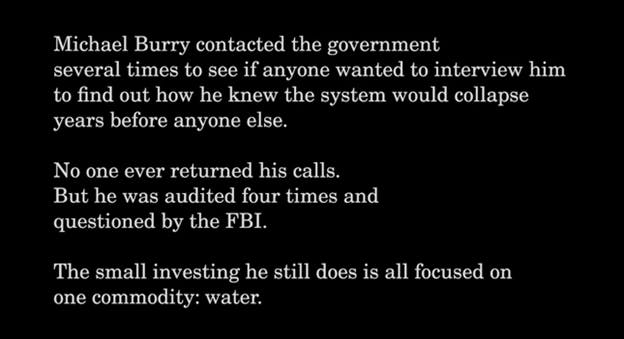
While not entirely accurate today (as of September 2022, Burry's latest 13-F says GEO Group Inc., a private corrections company, is his largest holding at 37.65%), the movie does bring up a good point: why not consider investing in water?
The bull argument is that water is finite, essential, and increasingly scarce, which should drive up demand. The bear case is that these considerations are more or less priced in already. It also doesn’t help that most investors do not have the capital or knowledge to trade CME water futures.
Still, water remains one of the more longstanding thematic investment options out there, even after the recent disruptive tech run-up. Thematic ETFs tracking companies in the water industry have been around for quite some time now. Here are the top three water ETFs of 2023.
Like what you're reading?
Stay in the loop — get the latest ETF insights: trends, analysis, and expert picks.
First Trust Water ETF (FIW)
FIW is one of those ETFs that blurs the line between active and passive management, and that’s not a bad thing. While the ETF does track the ISE Clean Edge Water Index, the index has some stringent filters in place when it comes to market capitalization, liquidity, and weighting concentration.
After these screeners do their job, the index selects the top 36 water industry companies by market capitalization and rebalances them semi-annually. This rules-based methodology results in better consistency compared to active ETFs, and more specificity compared to passive ETFs.
The ETF has performed exceptionally well, with a five-star Morningstar rating based on its 10-year risk-adjusted return in a universe of 87 natural resource ETFs. Over the trailing 10-year period, the ETF has returned 12.59% annualized, beating the Russell 3000 which returned 12.13%.
Invesco Water Resources ETF (PHO)
For a more traditional passive indexing approach to water investing, investors can consider PHO, which tracks the NASDAQ OMX US Water Index. This index targets U.S.-listed companies that conserve and purify water for homes, businesses and industries, or manufacture water equipment.
In terms of industry representation, PHO holds a fairly diversified assortment of water machinery, utility, chemical, construction, and services companies. Like most water ETFs, PHO has a heavy 41.3% mid-cap blend focus. In fact, only around 30% of the ETF is held in large caps.
In a rare example of more active ETFs beating traditional passive ones, PHO has actually underperformed FIW over the trailing 10 years with a 10.06% annualized return. It also lost to the S&P 500, which returned 12.56% during this period. Still, it remains popular due to Invesco's brand name.
Invesco Global Water ETF (PIO)
For a global focus when it comes to water investing, investors can buy PIO, which is essentially PHO with an international equity allocation. This ETF tracks the similar Nasdaq OMX Global Water Index, which as its name suggests holds global water equities with a mid-cap blend concentration like PHO.
Like PHO, the majority of PIO's holdings fall into the industrial (44.85%) and utilities (28.09%) sectors. The ETF has a U.S. bias at 54.3% due to the market-cap weighting methodology, with developed and emerging market countries like the U.K., Japan, Switzerland, Brazil, France, and China making up the rest.
PIO's performance history only goes back five years, where it returned an annualized 6.44%. This dramatically underperformed PHO and FIW, which returned an annualized 11.69% and 11.74% respectively. The underperformance of international equities can be blamed for this.
Please note this article is for information purposes only and does not in any way constitute investment advice. It is essential that you seek advice from a registered financial professional prior to making any investment decision.
Latest ETF News
See all ETF newsMoneyShow Chart of the Day 9/4/26: Don't Just Watch Oil. Watch THESE.


Chart of the Day 8/14/26: The Great "Hot Money" Migration

MoneyShow Chart of the Day 7/29/26: Now, THAT's What I Call Market Rotation!

MoneyShow Chart of the Day 7/16/26: Good News/Bad News on Inflation (and the Fed)




 Advantages of ETFs over Mutual Funds1/6
Lower Costs
In this guide, we'll explore the advantages of ETFs over mutual funds, giving you valuable insights into why ETFs have gained significant popularity among investors like yourself.
Leveraged ETFs: Unlocking the Potential for Amplified Returns1/6
Understanding Leveraged ETFs
Explore leveraged ETFs: potential for amplified returns & risks. 5 ETFs to consider across equities, commodities & fixed income.
What is a Leveraged ETF?1/6
Introducing Leveraged and Inverse ETFs
In this guide, we'll dive into the world of leveraged ETFs, exploring their definition, mechanics, potential risks, and rewards.
Recent educational content

ETF Trends
ETF Industry KPIs September 8, 2026
This week’s KPI data overview highlights key metrics and trends shaping the ETF landscape.

ETF Trends
ETF Industry KPIs August 31, 2026
This week’s KPI data overview highlights key metrics and trends shaping the ETF landscape.
ETF Trends
ETF Industry KPIs August 24, 2026
This week’s KPI data overview highlights key metrics and trends shaping the ETF landscape.
What’sTheFund
What's the Fund | Ocean Park Diversified Income ETF (DUKZ)
James St Aubin, Chief Investment Officer at Ocean Park Asset Management, discuss the DUKZ ETF, exposing investors to the whole spectrum of asset classes in the fixed income markets, through their rules-based process.

Browse all educational columns



Active Trader Report: Use of Leveraged & Inverse ETFs Way Up
Direxion partnered with Compound Insights and Vanda to explore what’s driving the evolution of active trading — and how active traders are using leveraged and inverse funds across equities, single stocks, commodities, and volatility.