Open Now: The Global ETF Survey Take the Survey →




Week of September 26, 2022 KPI summary
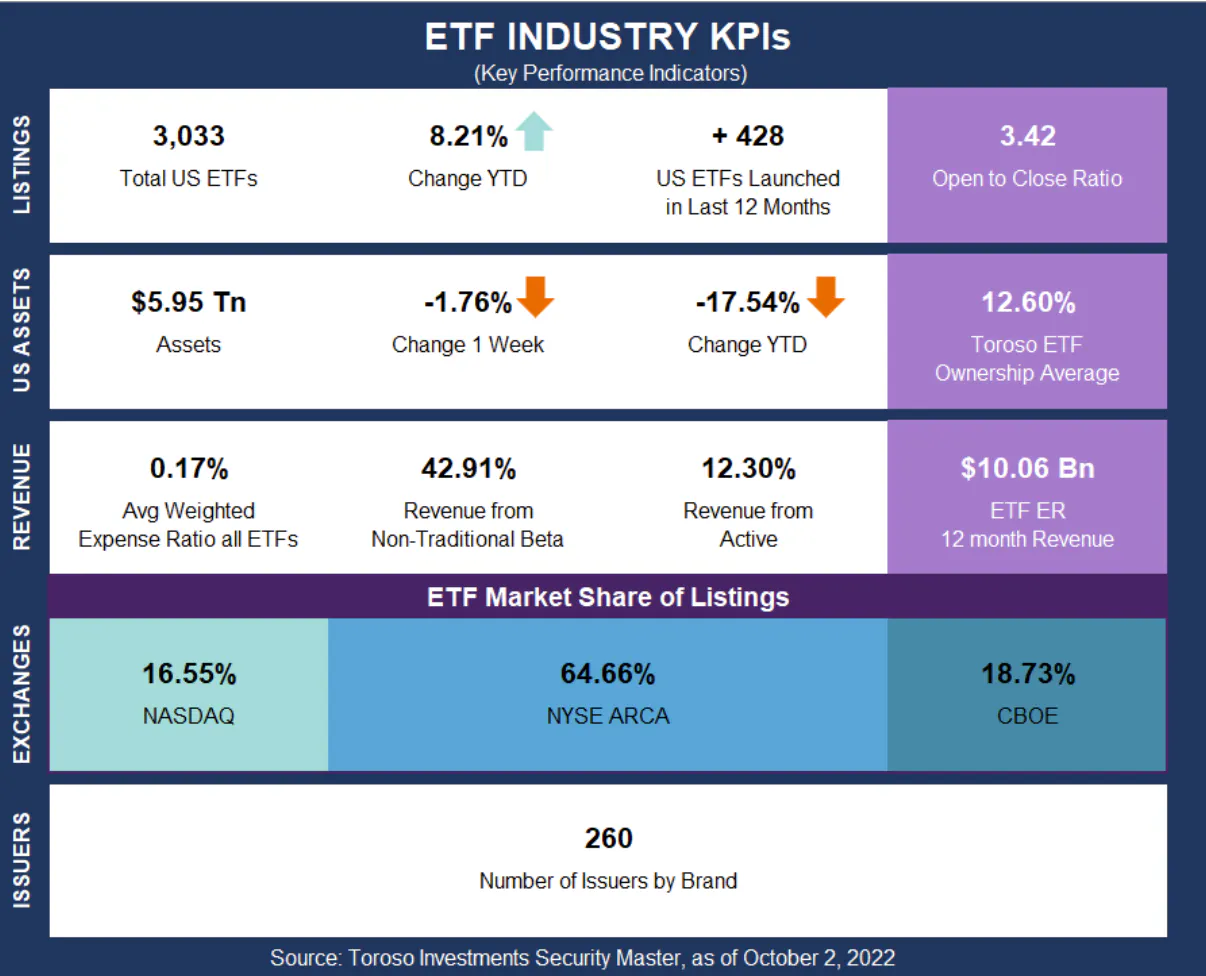
This week, the industry experienced 9 ETF launches and zero closures, shifting the 1-year Open-to-Close ratio to 3.42 and total US ETFs to 3,033.


This week, the industry experienced 9 ETF launches and zero closures, shifting the 1-year Open-to-Close ratio to 3.42 and total US ETFs to 3,033.
September was a down month for the ETF industry in terms of assets. It was 3rd worst in 2022 thus far with April (-7.53) and June (-7.22) being slightly below. Note the data below will compare 9/4/22 KPIs to 10/2/22.
> Total assets decreased -6.68%, there was an increase of 46 ETFs to total US ETF count (3,033), and +3 additional issuers by brand.
> From our 11 asset class categories, Managed Futures increased the most by far (47.28%) with Currency as the only other category in the black (0.43%). Commodities Derivative had the worst performance (-9.22%) with Geared/Swaps closely behind (-8.24%). The two largest asset classes of Equity (75.32% of assets) and Fixed Income (19.79%) dropped -7.81% and -2.44% respectively.
> > Note, this is consecutive months with Managed Futures and Currency as the top 2.
> ETF expense ratio 12-month revenue decreased from $10.86 Billion to $10.06 Billion.
> Revenue from Active ETFs inched up from 11.98% to 12.30%.
After a +2.53% first week of September, assets dropped -9.0% from $6.54 Tn to $5.95 Tn. ETF assets dropped below $6 Tn, testing 18-month lows in a sign that the markets are sparing no one. On the other hand, the increase of 46 ETFs this month is a large jump from August’s +8.
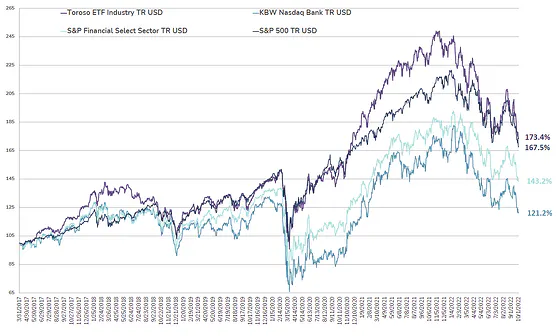
The tracked indexes had similar experiences in September. The Toroso ETF Industry Index was down -9.00% while the S&P Financial Select Sector Index led at -7.76%.
The ETF Industry Is Evolving Fast
From AI infrastructure to active strategies, the ETF landscape is shifting. Share your perspective in the 7th Annual Global ETF Survey and get exclusive early access to the final report.
ETF Launches
Avantis® All Equity Markets ETF (ticker: AVGE)
Avantis® Inflation Focused Equity ETF (ticker: AVIE)
AXS Green Alpha ETF (ticker: NXTE)
John Hancock U.S. High Dividend ETF (ticker: JHDV)
Noble Absolute Return ETF (ticker: NOPE)
Altrius Global Dividend ETF (ticker: DIVD)
Putnam BDC Income ETF (ticker: PBDC)
Putnam Biorevolution ETF (ticker: SYNB)
Simplify Bitcoin Strategy PLUS Income ETF (ticker: MAXI)
ETF Closures
None
Fund/Ticker Changes
None
TETF.Index Performance vs. S&P Financial Select Sector Index (as of September 30, 2022)

TETF.Index Performance vs. Other Leading Financial Indices (March 31, 2017 through September 30, 2022)
Source: Morningstar Direct
Why Follow the ETF Industry KPIs
The team at Toroso Investments began tracking the ETF Industry Key Performance Indicators (KPI's) in the early 2000's and have been consistently reporting on, and analyzing these metrics ever since. The table above was the impetus for the creation of the TETF.Index, the index that tracks the ETF industry. Each week, we will share the statistics we believe to be the most useful for identifying industry trends, in addition to the performance of the TEFT.Index.
Segments
See all
No specific market segments were tagged
Mentioned ETFs
No specific ETFs were tagged
Further reading



Latest publications
See allETF Industry KPIs – 12/16/2024
ETF Industry KPIs – 12/2/2024

ETF Industry KPIs – 11/18/2024

ETF Industry KPIs – 11/4/2024

ETF Industry KPIs – 10/28/2024
ETF Industry KPIs – 10/21/2024
ETF Industry KPIs – 10/7/2024
ETF Industry KPIs – 9/30/2024
ETF Industry KPIs – 9/16/2024
ETF Industry KPIs – 9/3/2024



Expert-Built ETF Portfolios, All in One Place
Don’t start from scratch. Discover ready-made ETF portfolios built by professionals to match different goals, timelines, and market views. Use them as inspiration or as a starting point for your own allocation.