Open Now: The Global ETF Survey Take the Survey →




Week of September 19, 2022 KPI summary
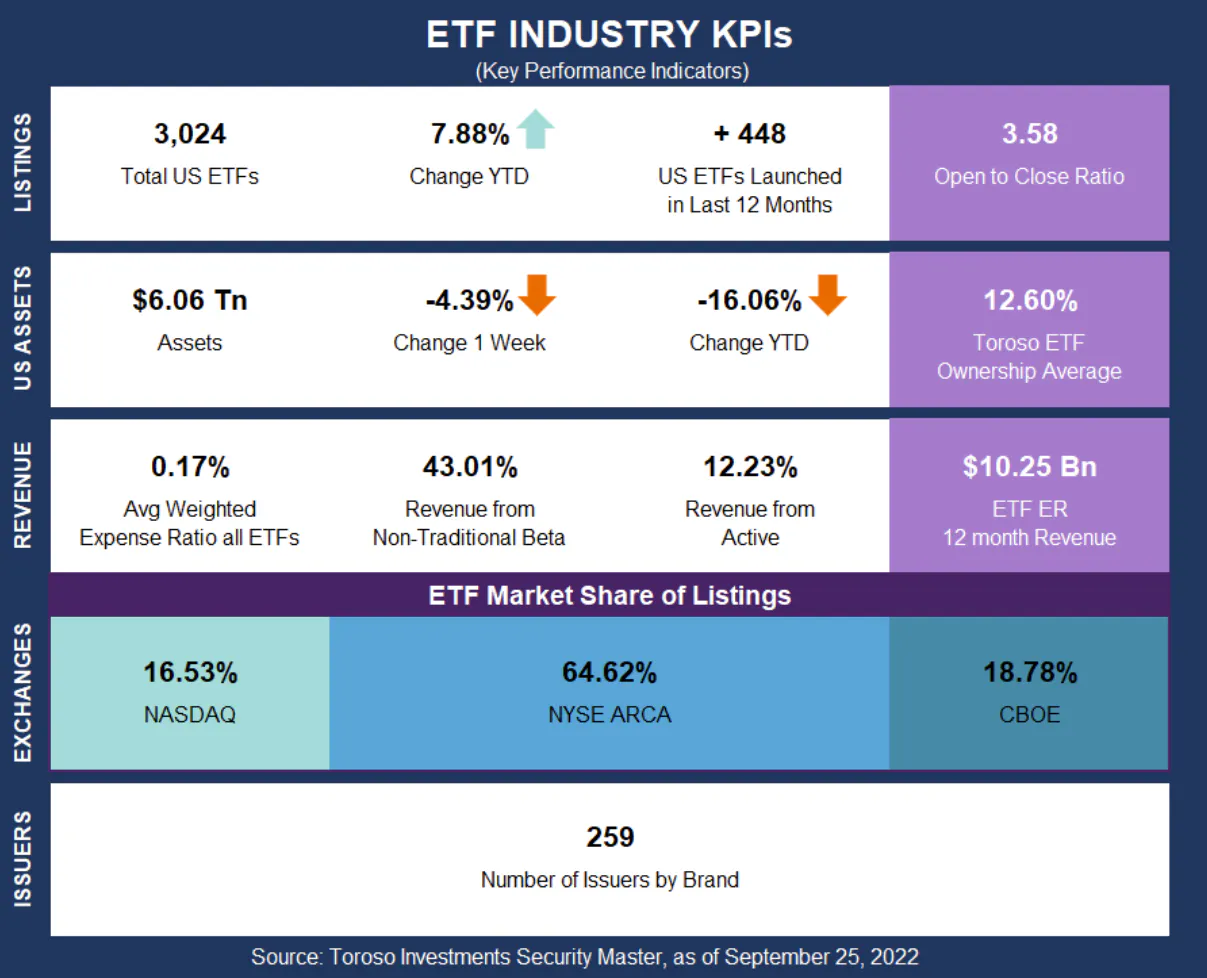
This week, the industry experienced 4 ETF launches and 0 closures, shifting the 1-year Open-to-Close ratio to 3.58 and total US ETFs to 3,024. It is finally getting cooler, and Fall is here! Let’s take a look at how the ETF Industry handled the heat of Summer 2022.


This week, the industry experienced 4 ETF launches and 0 closures, shifting the 1-year Open-to-Close ratio to 3.58 and total US ETFs to 3,024.
It is finally getting cooler, and Fall is here! Let’s take a look at how the ETF Industry handled the heat of Summer 2022 (data compares June 19, 2022 to September 25, 2022):
> 2.51% increase in total US ETFs (+74), but a -0.43% decrease in total assets (approximately $26 Bn).
> From our 11 asset class categories, Managed Futures increased the most in assets (83.6%) with Currency as next highest (22.5%). Commodities Derivative had the largest drop in assets (-24.9%) with Commodities Physical close behind (-19.3%). The two largest asset classes of Equity (75.6% of assets) and Fixed Income (19.5%) declined -0.4% and up 2.2% respectively.
> > The Managed Futures category is actually up 254.8% since the beginning of Spring! This category totals $1.35 Bn from 5 funds.
> 3.4% decrease in ETF expense ratio 12-month revenue.
> Revenue from Active ETFs shot up from 11.64% to 12.23%.
> Same number of issuers (259) at the end of Summer.
After a positive start to the Summer, assets declined to finish around where they started. Summers performance closely mimics Winter 2022, where assets were down -0.85% and ETF listings were +90. This is 3 straight seasons of a dip in assets yet rise in ETF listings and revenue from Active ETFs.
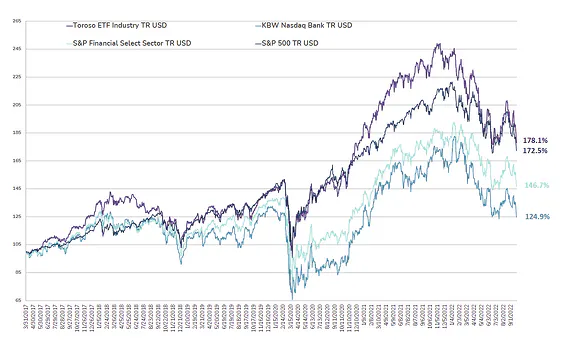
The tracked indexes had different experiences over the Summer. Toroso ETF Industry Index was down -2.74% while the S&P Financial Select Sector Index led at 0.14%.
Like what you're reading?
Stay in the loop — get the latest ETF insights: trends, analysis, and expert picks.
ETF Launches
Carbon Collective Climate Solutions U.S. Equity ETF (ticker: CCSO)
FT Cboe Vest U.S. Equity Enhance & Moderate Buffer ETF - September (ticker: XSEP)
iShares MSCI Water Management Multisector ETF (ticker: IWTR)
WisdomTree Emerging Markets ex-China ETF (ticker: XC)
TETF.Index Performance vs. S&P Financial Select Sector Index
(as of September 23, 2022)

TETF.Index Performance vs. Other Leading Financial Indices
(March 31, 2017 through September 23, 2022)
Source: Morningstar Direct
Segments
See all
No specific market segments were tagged
Mentioned ETFs
No specific ETFs were tagged
Further reading



Latest publications
See allETF Industry KPIs – 12/16/2024
ETF Industry KPIs – 12/2/2024
ETF Industry KPIs – 11/18/2024
ETF Industry KPIs – 11/4/2024
ETF Industry KPIs – 10/28/2024
ETF Industry KPIs – 10/21/2024
ETF Industry KPIs – 10/7/2024
ETF Industry KPIs – 9/30/2024
ETF Industry KPIs – 9/16/2024
ETF Industry KPIs – 9/3/2024



Active Trader Report: Use of Leveraged & Inverse ETFs Way Up
Direxion partnered with Compound Insights and Vanda to explore what’s driving the evolution of active trading — and how active traders are using leveraged and inverse funds across equities, single stocks, commodities, and volatility.