Open Now: The Global ETF Survey Take the Survey →




Week of October 3, 2022 KPI summary
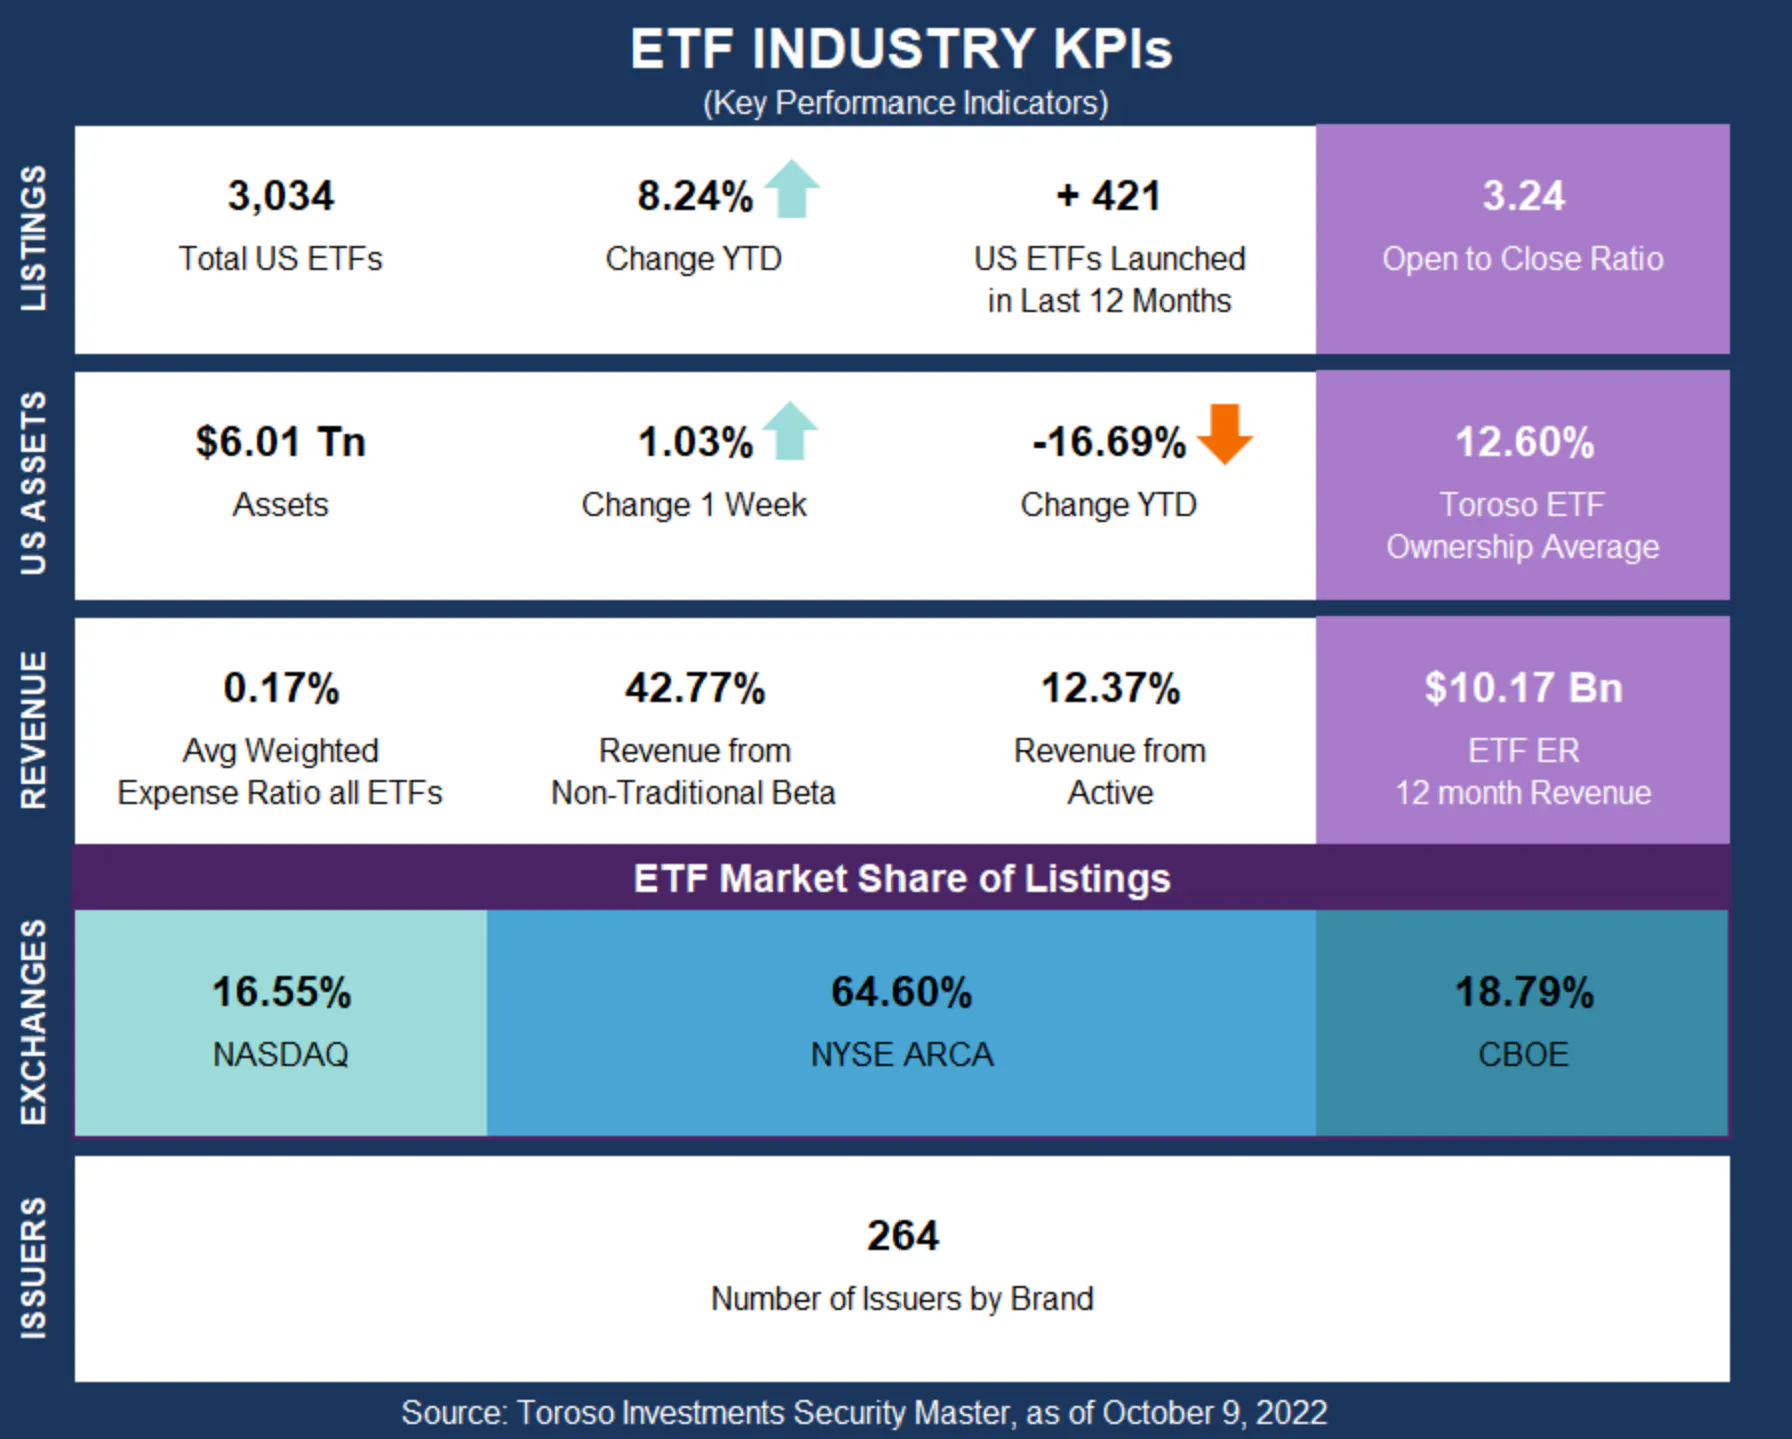
This week, the industry saw 9 ETF launches and 8 closures, shifting the 1-year Open-to-Close ratio to 3.24 and total US ETFs to 3,034. As the 3rd Quarter of 2022 has wrapped up, let’s take a look at some KPIs that stand out (comparing July 3, 2022 to October 2, 2022).


This week, the industry saw 9 ETF launches and 8 closures, shifting the 1-year Open-to-Close ratio to 3.24 and total US ETFs to 3,034.
As the 3rd Quarter of 2022 has wrapped up, let’s take a look at some KPIs that stand out (comparing July 3, 2022 to October 2, 2022).
> Total assets dropped -4.48%; there was a net increase of 65 ETFs during the quarter, bringing the US ETF count to 3,033, which is +230 YTD; and there were 0 additional issuers by brand.
> From our 11 asset class categories, Managed Futures increased the most (88.90%) with Currency in second (21.31%). Commodities Derivative had the worst performance (-18.53%) with Commodities Physical next (-15.00%). The two largest asset classes of Equity (75.32% of assets) and Fixed Income (19.79%) dropped -5.30% and inched up 0.02% respectively.
> ETF expense ratio 12-month revenue dipped from $10.76 Billion to $10.06 Billion.
> The revenue from Active ETFs increased from 11.68% to 12.30%.
Although a decline in total ETF assets of 4.48% is better than Q2’s -12.0% mark, it leaves the ETF industry at 18-month lows in assets, with revenues barely above the $10 Billion mark.
There was nearly the same increase in total ETFs as Q2 (+65 compared vs. +68 the previous quarter), however, the open-to-close ratio dropped to 3.42 (from 4.44) with significantly more closures seen this quarter: 52 in Q3 vs. 51 in Q1 + Q2 combined.
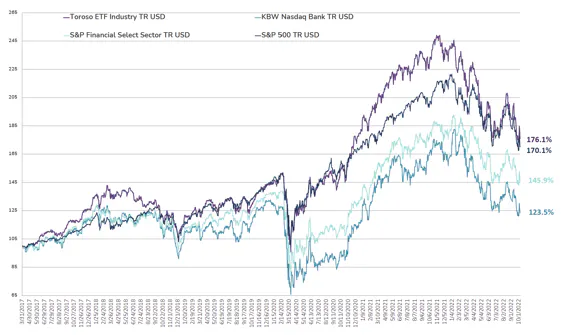
The tracked indexes had similar experiences in Q3 2022. The Toroso ETF Industry Index was down -4.11% while the S&P Financial Select Sector Index led at -3.10%.
The ETF Industry Is Evolving Fast
From AI infrastructure to active strategies, the ETF landscape is shifting. Share your perspective in the 7th Annual Global ETF Survey and get exclusive early access to the final report.
ETF Launches
Bitwise Web3 ETF (ticker: BWEB)
BlackRock Floating Rate Loan ETF (ticker: BRLN)
Global X Russell 2000 Covered Call & Growth ETF (ticker: RYLG)
NightShares 500 1x/1.5x ETF (ticker: NSPL)
VanEck Morningstar SMID Moat ETF (ticker: SMOT)
Distillate Small/Mid Cash Flow ETF (ticker: DSMC)
Strive U.S. Semiconductor ETF (ticker: SHOC)
Thrivent Small-Mid Cap ESG ETF (ticker: TSME)
7.125% Fixed-Rate Reset Subordinated Debentures due 2052 ETF (ticker: RZC)
ETF Closures
Direxion Russell 1000® Value Over Growth ETF (ticker: RWVG)
Direxion Russell 1000® Gr Over Value ETF (ticker: RWGV)
Direxion Fallen Knives ETF (ticker: NIFE)
Direxion World Without Waste ETF (ticker: WWOW)
Direxion Daily Cloud Computing Bear 2X ETF (ticker: CLDS)
Direxion Daily 5G Communications Bull 2X ETF (ticker: TENG)
Direxion Low Priced Stock ETF (ticker: LOPX)
Amplify Pure Junior Gold Miners ETF (ticker: JGLD)
Fund/Ticker Changes
First Trust FTSE EN Developed Markets Real Estate ETF (ticker: FFR)
became First Trust Alerian Disruptive Technology Real Estate ETF (ticker: DTRE)
TETF.Index Performance vs. S&P Financial Select Sector Index (as of October 7, 2022)

TETF.Index Performance vs. Other Leading Financial Indices (March 31, 2017 through October 7, 2022)
Source: Morningstar Direct
Segments
See all
No specific market segments were tagged
Mentioned ETFs
No specific ETFs were tagged
Further reading



Latest publications
See allETF Industry KPIs – 12/16/2024
ETF Industry KPIs – 12/2/2024
ETF Industry KPIs – 11/18/2024
ETF Industry KPIs – 11/4/2024
ETF Industry KPIs – 10/28/2024
ETF Industry KPIs – 10/21/2024
ETF Industry KPIs – 10/7/2024
ETF Industry KPIs – 9/30/2024
ETF Industry KPIs – 9/16/2024
ETF Industry KPIs – 9/3/2024



Build and Analyze Your ETF Portfolio Like a Pro
Create your own ETF portfolio in minutes and instantly see allocations, exposures, performance, and risk. Visualize diversification across asset classes, regions, and sectors. Stress-test ideas, compare benchmarks, and refine your strategy with professional-grade analytics.
