Open Now: The Global ETF Survey Take the Survey →




Week of October 24, 2022 KPI Summary
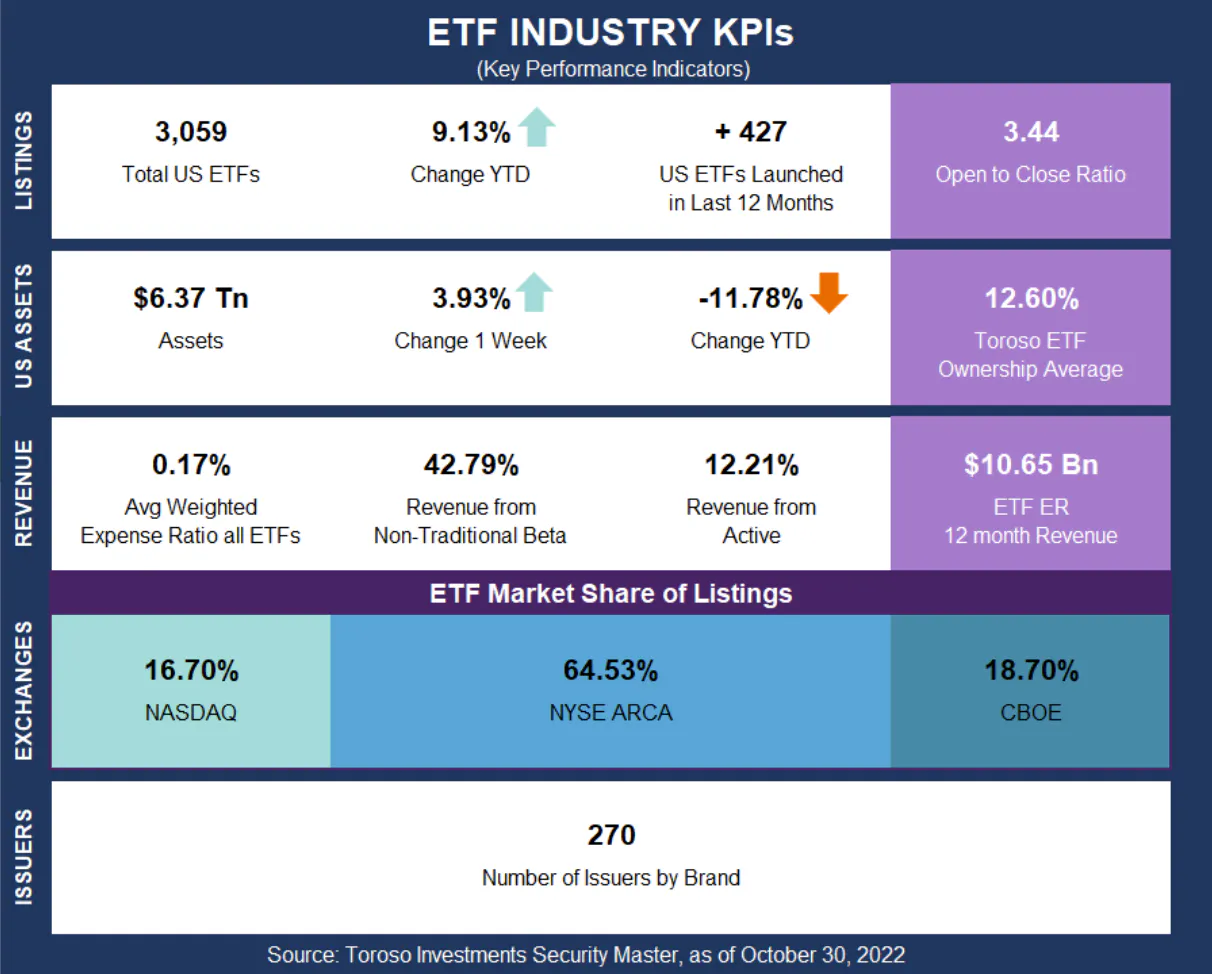
This week, the industry experienced 13 ETF launches and 0 closures, shifting the 1-year Open-to-Close ratio to 3.44 and total US ETFs to 3,059.


This week, the industry experienced 13 ETF launches and 0 closures, shifting the 1-year Open-to-Close ratio to 3.44 and total US ETFs to 3,059.
October was a great month for the ETF industry.
> It was the #1 increase in assets (+6.99%) with July in a close second place (+6.25%). Note the data below will compare 10/2/22 KPIs to 10/30/22. Total assets increased 6.99%, there was an increase of 26 ETFs to total US ETF count (3,059), and +10 additional issuers by brand.
> > This 6.99% change in assets followed September’s -6.68%, the largest difference month-to-month in 2022 thus far.
From our 11 asset class categories, Managed Futures increased the most by far (18.09%) with Equity next (8.67%). Volatility had the worst performance (-21.95%) with Preferred Stock as second worst (-6.19%). The two largest asset classes of Equity (76.50% of assets) and Fixed Income (18.87%) surged 8.67% and 2.01% respectively.
> Note, this is 8 consecutive months with Managed Futures as a top 2 category!
> ETF expense ratio 12-month revenue increased from $10.06 Billion to $10.65 Billion.
The main story of this month is twofold: An increase of 10 issuers and the best month in assets in 2022 thus far.
> The +26 in ETFs falls around the average for a month, but the +10 issuers is an outlier jump that should be noted. Going into October with only a total increase of +2 issuers since February, +10 is the best month of 2022 by far.
> Surprisingly, through 10 months of 2022, 5 months have had positive change in assets and 5 have been negative. However, with the -11.78% YTD change, one could conclude that the bad months have been worse than the good months have been good. With that said, October helped make up for the previous two month's -10.34% total change.
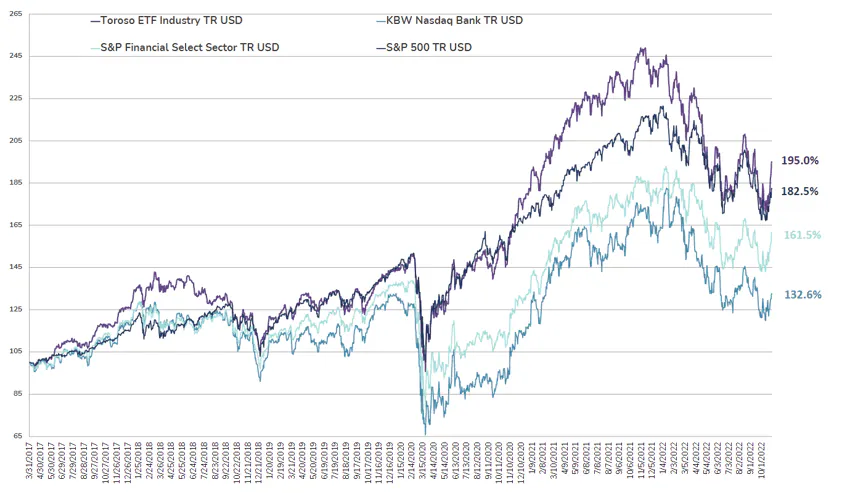
The tracked indexes had similar experiences in October. The Toroso ETF Industry Index was up 9.56% while the S&P Financial Select Sector Index led at 10.23%.
The ETF Industry Is Evolving Fast
From AI infrastructure to active strategies, the ETF landscape is shifting. Share your perspective in the 7th Annual Global ETF Survey and get exclusive early access to the final report.
ETF Launches
Simplify Stable Income ETF (ticker: BUCK)
Capital Group U.S. Multi-Sector Income ETF (ticker: CGMS)
Capital Group Municipal Income ETF (ticker: CGMU)
Capital Group Short Duration Income ETF (ticker: CGSD)
First Trust Growth Strength ETF (ticker: FTGS)
Simplify Enhanced Income ETF (ticker: HIGH)
IQ MacKay ESG High Income ETF (ticker: IQHI)
IQ Candriam ESG U.S. Mid Cap Equity ETF (ticker: IQSM)
First Trust Indxx Aerospace & Defense ETF (ticker: MISL)
Neuberger Berman Commodity Strategy ETF (ticker: NBCM)
Soundwatch Hedged Equity ETF (ticker: SHDG)
T. Rowe Price U.S. High Yield ETF (ticker: THYF)
Angel Oak UltraShort Income ETF (ticker: UYLD)
ETF Closures
None
Fund/Ticker Changes
Neuberger Berman Commodity Strategy Fund (ticker: NRBIX)
became Neuberger Berman Commodity Strategy ETF (ticker: NBCM)
TETF.Index Performance vs. S&P Financial Select Sector Index (as of October 28, 2022)

TETF.Index Performance vs. Other Leading Financial Indices (March 31, 2017 through October 28, 2022)
Source: Morningstar Direct
Segments
See all
No specific market segments were tagged
Mentioned ETFs
No specific ETFs were tagged
Further reading



Latest publications
See allETF Industry KPIs – 12/16/2024
ETF Industry KPIs – 12/2/2024

ETF Industry KPIs – 11/18/2024

ETF Industry KPIs – 11/4/2024

ETF Industry KPIs – 10/28/2024

ETF Industry KPIs – 10/21/2024

ETF Industry KPIs – 10/7/2024

ETF Industry KPIs – 9/30/2024
ETF Industry KPIs – 9/16/2024
ETF Industry KPIs – 9/3/2024



The ETF Industry Is Evolving Fast
From AI infrastructure to active strategies, the ETF landscape is shifting. Share your perspective in the 7th Annual Global ETF Survey and get exclusive early access to the final report.