Open Now: The Global ETF Survey Take the Survey →




Week of November 28, 2022 KPI Summary
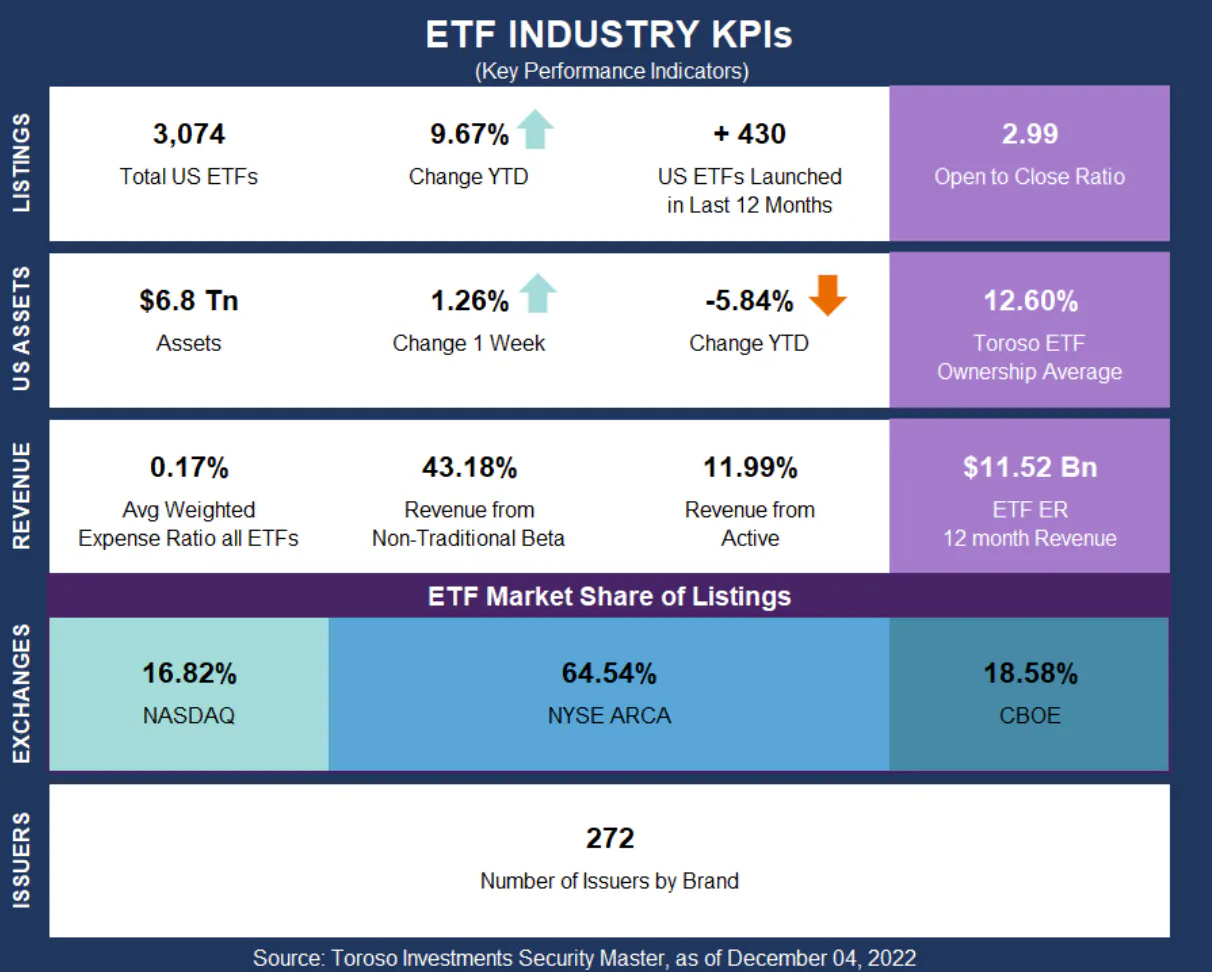
This week, the industry experienced 7 ETF launches and 5 closures, shifting the 1-year Open-to-Close ratio to 2.99 and total US ETFs to 3,074. Another positive week for ETF assets, so let's look at the industry progress and other data points that jump out.


This week, the industry experienced 7 ETF launches and 5 closures, shifting the 1-year Open-to-Close ratio to 2.99 and total US ETFs to 3,074.
Another positive week for ETF assets, so let's look at the industry progress and other data points that jump out.
Like what you're reading?
Stay in the loop — get the latest ETF insights: trends, analysis, and expert picks.
Total ETF assets reach $6.8 Trillion. Assets peaked at that height in our August 14 KPIs nearly 4 months ago, and again 4 months before that on April 17, 2022. We’ll see if this ceiling is broken over the next few weeks, but certainly noteworthy for these 4-month potential peaks.
As we have been reporting all year, the open-to-close ratio has been slowly falling from 5.77 eight months ago to 2.99 currently (using the prior example date of April 17th). This has been due to a slight decrease in launches and a major uptick in closures.
With the open-to-close ratio decreasing, so has the rate of new issuers in the ETF industry in 2022 thus far. There were 76 additional issuers in 2021, and only 26 YTD in 2022. Just like fund closures, issuers closures have been a cause of this decline as well. Growth is good, but growth with trimming excess fat in our industry is healthy.
Our big news this week is our “ETF World Cup” article being released on Wednesday. As the bracket was set on Friday in the 2022 FIFA World Cup, we will use the same matchups and determine our winning country in the ETF World Cup. Each round will have a different scoring system to determine the winner. Check out our opening matchups below and let us know who you think should be moving on.
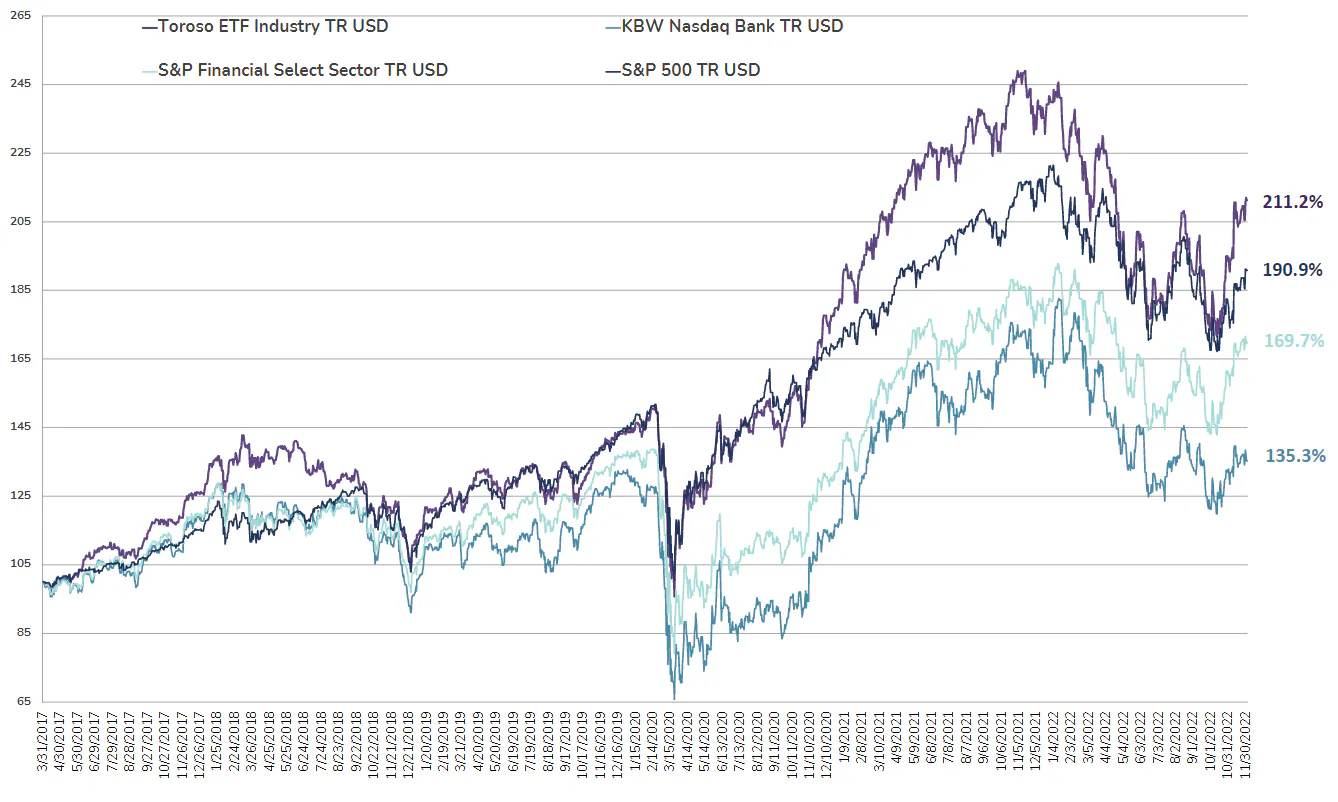
The tracked indexes had different experiences in the past week. The Toroso ETF Industry Index was up 0.79% while the S&P Financial Select Sector Index trailed at -0.55%.
ETF Launches
The Meet Kevin Pricing Power ETF (ticker: PP)
YieldMax Innovation Option Income Strategy ETF (ticker: OARK)
Nicholas Fixed Income Alternative ETF (ticker: FIAX)
ProShares S&P Global Core Battery Metals ETF (ticker: ION)
AllianzIM U.S. Large Cap Buffer10 December ETF (ticker: DECT)
AllianzIM U.S. Large Cap Buffer20 December ETF (ticker: DECW)
Main International ETF (ticker: INTL)
ETF Closures
Vanguard US Liquidity Factor ETF (ticker: VFLQ)
Ecofin Digital Payments Infrastructure ETF (ticker: ETPA)
Alpha Architect Merlyn.AI Tactical Growth & Income ETF (ticker: SNUG)
Inspire Faithward Large Cap Momentum ETF (ticker: FEVR)
Alpha Architect Merlyn.AI Best of Breed Core Momentum ETF (ticker: BOB)
TETF.Index Performance vs. S&P Financial Select Sector Index (as of December 2, 2022)

TETF.Index Performance vs. Other Leading Financial Indices (March 31, 2017 through December 2, 2022)
Source: Morningstar Direct
Segments
See all
No specific market segments were tagged
Mentioned ETFs
No specific ETFs were tagged
Further reading



Latest publications
See allETF Industry KPIs – 12/16/2024

ETF Industry KPIs – 12/2/2024

ETF Industry KPIs – 11/18/2024

ETF Industry KPIs – 11/4/2024

ETF Industry KPIs – 10/28/2024

ETF Industry KPIs – 10/21/2024

ETF Industry KPIs – 10/7/2024

ETF Industry KPIs – 9/30/2024

ETF Industry KPIs – 9/16/2024

ETF Industry KPIs – 9/3/2024




The ETF Industry Is Evolving Fast
From AI infrastructure to active strategies, the ETF landscape is shifting. Share your perspective in the 7th Annual Global ETF Survey and get exclusive early access to the final report.