Open Now: The Global ETF Survey Take the Survey →




Week of January 9, 2023 KPI Summary
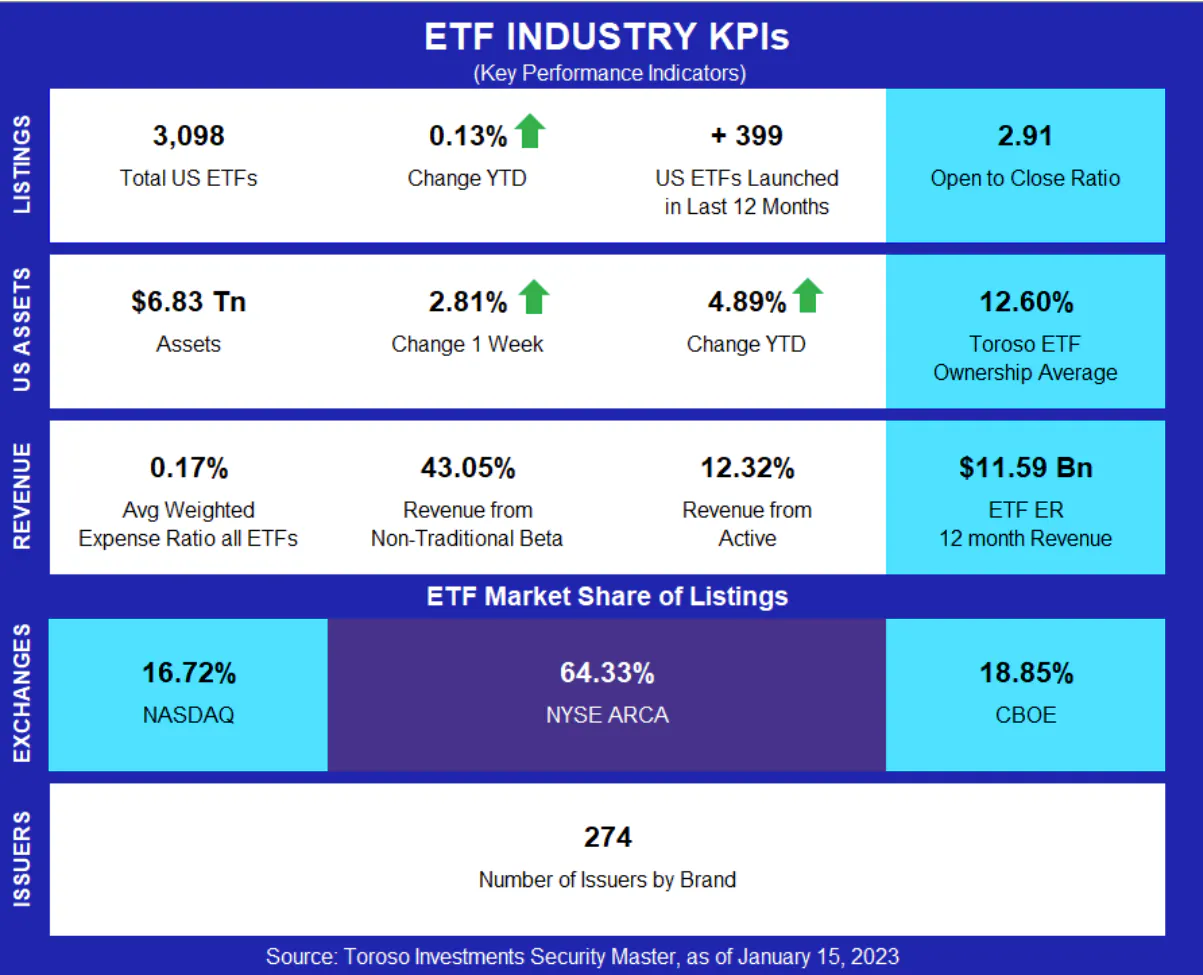
This week, the industry experienced 7 ETF launches and 1 closure, shifting the 1-year Open-to-Close ratio to 2.91 and total US ETFs to 3,098. After highlighting it last week in our 2022 review, we are taking a deeper look into Index performance in the ETF industry, specifically Active funds, which we haven’t dug into since last August.


This week, the industry experienced 7 ETF launches and 1 closure, shifting the 1-year Open-to-Close ratio to 2.91 and total US ETFs to 3,098.
After highlighting it last week in our 2022 review, we are taking a deeper look into Index performance in the ETF industry, specifically Active funds, which we haven’t dug into since last August.
> In the past 12-months, Active ETFs have increased their assets by 25.4% and amount of total funds by 30.4% (+241). Meanwhile, Traditional index funds have decreased in assets -5.9% and down 2 funds in total and Non-Traditional (known to many as “Smart Beta”) are also down -4.6% in assets and up 9 total funds.
> > Although the asset market share gain isn’t massive for Active ETFs (from 4.0% to 5.3% over 12-months), the quantity of funds has really affected the industry. The amount of Active funds has more than doubled over a 24-month time period (475 to 1033).
> The Predicted 12-month Revenue data has also taken a huge swing over the past two years.
> > On 1/17/2021, Traditional Index funds accounted for 51.7% of the predicted revenue, with Non-Traditional at 39.6% and Active with 8.7%. Since then, Traditional index has given up that lead and will likely soon be passed by Non-Traditional funds. Traditional index has 44.6%, Non-Traditional next with 43.1%, and Active rising to 12.3%.
> Of the total $1.16 Trillion of Predicted Revenue, the difference between Traditional and Non-Traditional is down to just $18.3 Billion.
> Lastly, we realize the asset data presented for each index is not directly correlated to the funds’ performances. According to our Security Master, Traditional funds are down an average of -7.6% over 12-months, which just edges out the Active index at -7.7%. Non-Traditional funds were hit the hardest by 2022’s downturn and have a 12-month average fund performance of -10.3%.
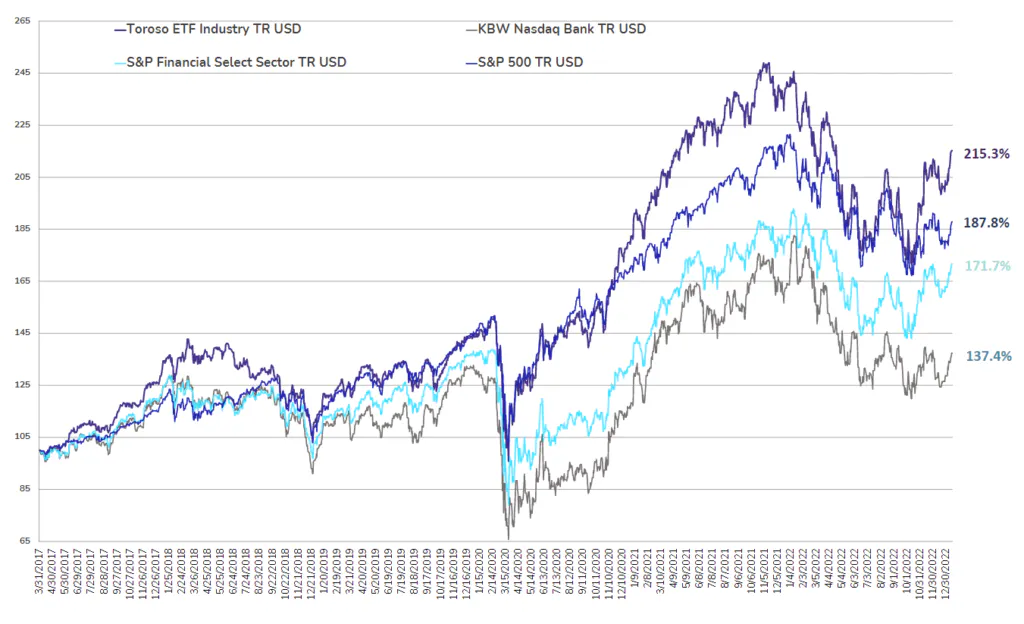
> The tracked indexes had similar experiences in the past week. The Toroso ETF Industry Index was up 3.29% while the S&P Financial Select Sector Index trailed at 2.05%.
Like what you're reading?
Stay in the loop — get the latest ETF insights: trends, analysis, and expert picks.
ETF Launches
Gabelli Equity Income ETF (ticker: GCAD)
Hypatia Women CEO ETF (ticker: WCEO)
KraneShares China Internet and Covered Call Strategy ETF (ticker: KLIP)
BlackRock AAA CLO ETF (ticker: CLOA)
Matthews Emerging Markets Ex China Active ETF (ticker: MEMX)
Mohr Sector Navigator ETF (ticker: ENAV)
USCF Sustainable Battery Metals Strategy ETF (ticker: ZSB)
ETF Closures
Viridi Bitcoin Miners ETF (ticker: RIGZ)
Fund/Ticker Changes
None
TETF.Index Performance vs. S&P Financial Select Sector Index (as of January 13, 2023)

TETF.Index Performance vs. Other Leading Financial Indices (March 31, 2017 through January 13, 2023)
Source: Morningstar Direct
Segments
See all
No specific market segments were tagged
Mentioned ETFs
No specific ETFs were tagged
Further reading



Latest publications
See allETF Industry KPIs – 12/16/2024

ETF Industry KPIs – 12/2/2024

ETF Industry KPIs – 11/18/2024

ETF Industry KPIs – 11/4/2024

ETF Industry KPIs – 10/28/2024

ETF Industry KPIs – 10/21/2024

ETF Industry KPIs – 10/7/2024

ETF Industry KPIs – 9/30/2024

ETF Industry KPIs – 9/16/2024

ETF Industry KPIs – 9/3/2024




Active Trader Report: Use of Leveraged & Inverse ETFs Way Up
Direxion partnered with Compound Insights and Vanda to explore what’s driving the evolution of active trading — and how active traders are using leveraged and inverse funds across equities, single stocks, commodities, and volatility.