Open Now: The Global ETF Survey Take the Survey →




ETF Industry KPIs – 1/2/2024
This week, the industry experienced 1 ETF launch and 8 closures, shifting the 1-year Open-to-Close ratio to 2.05 and total US ETFs to 3,377.

- This week, the industry experienced 1 ETF launch and 8 closures, shifting the 1-year Open-to-Close ratio to 2.05 and total US ETFs to 3,377.
- In our last KPI article, we celebrated US ETF assets crossing the $8 Trillion mark. With back-to-back positive 1-week changes since then, today’s $8.13 Trillion is the new record high for the industry. Let’s see how December did overall in a few noteworthy metrics we track (data comparing 12/3/23 – 12/31/23).Total assets increased 5.2%, there was an increase of 24 ETFs to total US ETF count (3,377), and 4 additional issuers by brand.From our 11 asset class categories, Geared/Swaps increased the most (7.7%) with Allocation next (5.9%). Currency had the worst performance (-9.2%) with Volatility at second worst (-8.4%). The two largest asset classes of Equity (76.6% of assets) and Fixed Income (18.2%) jumped 5.8% and 3.0% respectively.After 3 consecutive months (Aug – Oct) with Geared/Swaps in the bottom two performing categories, it moves to #1 for November and December.On the other hand, Volatility is bottom 2 for November and December after coming off consecutive months in the top 2 (Sept – Oct).The ETF expense ratio annual revenue increased from $12.3 Bn to $12.9 Bn.This is the highest ETF Expense Ratio Annual Revenue ever recorded for US ETF industry.This metric has been in the 12s in 46 different weeks in the past 3 years, never 12.9 or higher.
The ETF Industry Is Evolving Fast
From AI infrastructure to active strategies, the ETF landscape is shifting. Share your perspective in the 7th Annual Global ETF Survey and get exclusive early access to the final report.
- December ended 2023 on a positive note in the ETF industry. It was the 3rd largest increase in assets behind November (11.4%) and January (7.8%). With an uptick in closures, the +24 ETFs sit in the middle of the pack for total ETFs month over month, yet the lowest since July (+19). From August on, we have seen +23 issuers to the industry, a massive and consistent increase month to month (+4 lowest and +6 highest in 5-month span).
- Lastly, the last two weeks have set record highs in “ETFs launched in the last 12-months” with +512 last week and +514 the week before that (12/17/23 – 12/24/23).
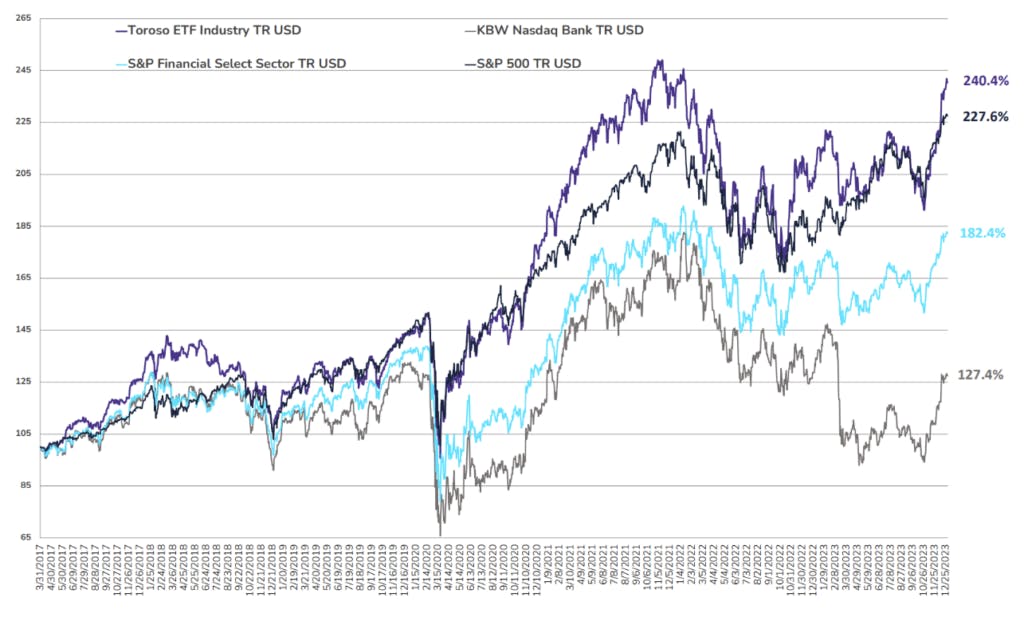
- The tracked indexes had different positive experiences in December. The Toroso ETF Industry Index was up 10.2% while the S&P Financial Select Sector Index trailed at 5.4%.

ETF Launches
Cyber Hornet S&P 500 and Bitcoin 75/25 Strategy ETF (ticker: ZZZ)
ETF Closures
Invesco BulletShares 2023 Corporate Bond ETF (ticker: BSCN)
Invesco BulletShares 2023 High Yield Corporate Bond ETF (ticker: BSJN)
Invesco BulletShares 2023 Municipal Bond ETF (ticker: BSMN)
JPMorgan Sustainable Consumption ETF (ticker: CIRC)
JPMorgan Social Advancement ETF (ticker: UPWD)
Merk Stagflation ETF (ticker: STGF)
Corbett Road Tactial Opportunity ETF (ticker: OPPX)
Armor US Equity Index ETF (ticker: ARMR)
Fund/Ticker Changes
None
TETF.Index Performance vs. S&P Financial Select Sector Index
(as of December 29, 2023)

TETF.Index Performance vs. Other Leading Financial Indices (March 31, 2017 through December 29, 2023)
Segments
See all
No specific market segments were tagged
Mentioned ETFs
No specific ETFs were tagged
Further reading



Latest publications
See allETF Industry KPIs – 12/16/2024

ETF Industry KPIs – 12/2/2024

ETF Industry KPIs – 11/18/2024

ETF Industry KPIs – 11/4/2024

ETF Industry KPIs – 10/28/2024

ETF Industry KPIs – 10/21/2024

ETF Industry KPIs – 10/7/2024

ETF Industry KPIs – 9/30/2024

ETF Industry KPIs – 9/16/2024

ETF Industry KPIs – 9/3/2024




Expert-Built ETF Portfolios, All in One Place
Don’t start from scratch. Discover ready-made ETF portfolios built by professionals to match different goals, timelines, and market views. Use them as inspiration or as a starting point for your own allocation.