Open Now: The Global ETF Survey Take the Survey →




ETF Industry KPI – 2/13/2023
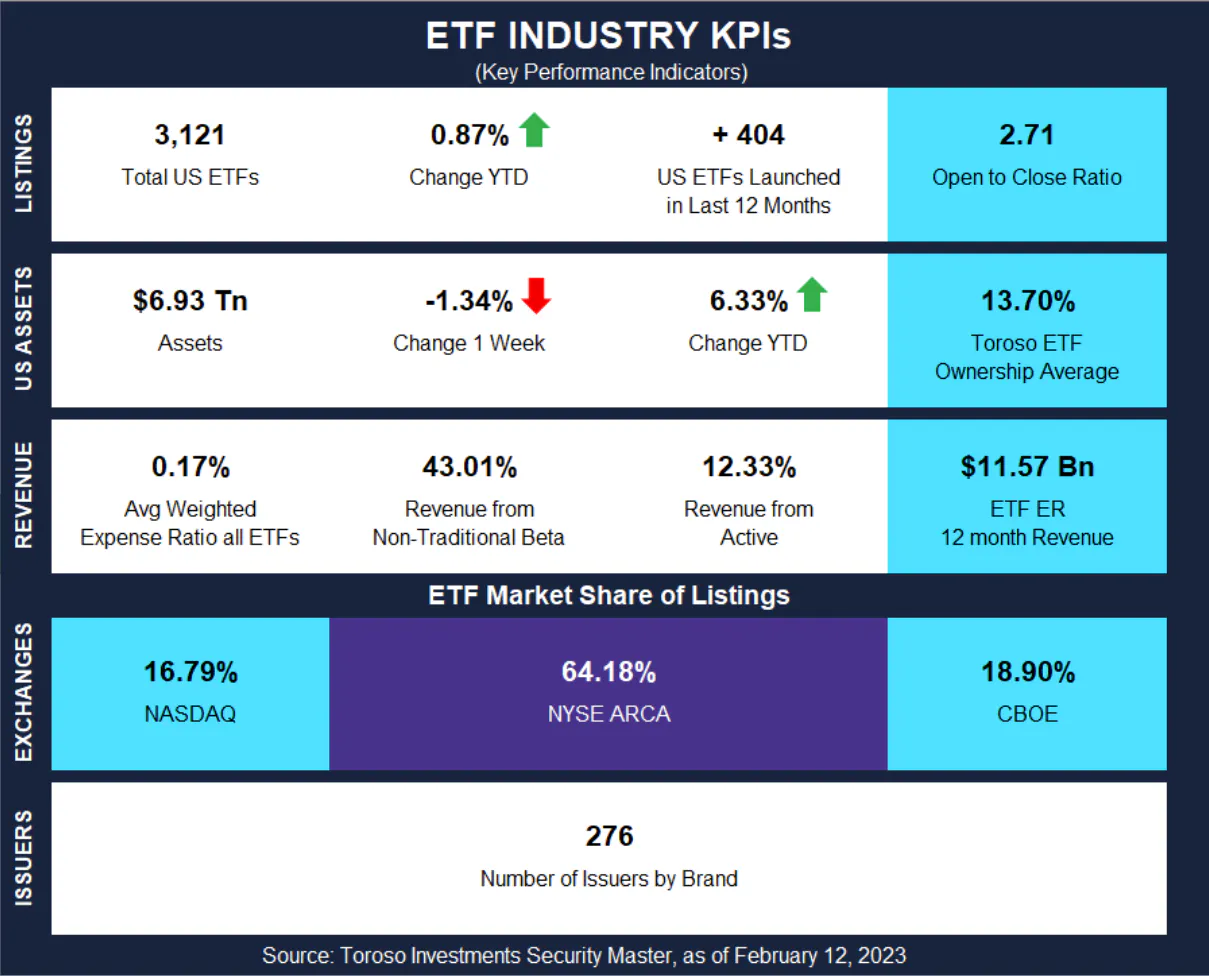
This week, the industry experienced 6 ETF launches and 3 closures, shifting the 1-year Open-to-Close ratio to 2.71 and total US ETFs to 3,121.


This week, the industry experienced 6 ETF launches and 3 closures, shifting the 1-year Open-to-Close ratio to 2.71 and total US ETFs to 3,121.
Now that Superbowl Sunday is behind us, it’s possible another American holiday has snuck up on some of us: Valentine’s Day. Last year, we wrote about Valentine’s Day near all-time high spending and expensive ETFs. With lovebird spending predicted to be up 8% from 2022 (according to Statista), let’s run this back and see where there is a trend or a change.
The ETF Industry Is Evolving Fast
From AI infrastructure to active strategies, the ETF landscape is shifting. Share your perspective in the 7th Annual Global ETF Survey and get exclusive early access to the final report.
Examining ETFs with expense ratios of 0.75 and higher (which make up approximately 20.7% of total US ETFs), they are returning 4.42% YTD on average, slightly underperforming the industry at 5.44%.
> In 2022, the 0.75 and higher ER ETFs made up 19% and outperformed the industry.
> The 648 ETFs that charge 75 bips or more make up approximately 2.21% of the industry (~$152 Billion), though it is top heavy with the largest 5 totaling $35.7 Billion in assets (23.5% of the $152 Billion).
> > In 2022, the top 5 totaled $47.3 Billion (26.9% in comparison). This is due to these expensive ETFs underperforming the industry. While the industry is down -6.76% in 12-months, the 75 bips and up club is down -9.2%.
> Of those 648 ETFs, 29 were launched in the past 12-months with assets totaling $1.0 Billion.
> > 13 of the 29 are Geared/Swaps by Direxion, many of which are single stock ETFs.
> Lastly, Active funds combine for 57.1% of these expensive ETFs while making up 33.6% of the current ETF fund total. In comparison, last year’s active funds were 49.8% of expensive ETFs while Active ETFs were 28.1% of the industry. Active ETFs do have the highest average expense ratio at 0.52 compared to Non-Traditional (0.41) and Traditional (0.35) ETFs.
As Valentine’s Day is getting more expensive for Americans, the ETF industry has become slightly more costly over the past 12-months, as well. Though the average expense ratio is up from 0.41 to 0.43, the weight average is down from 0.27 to 0.24.
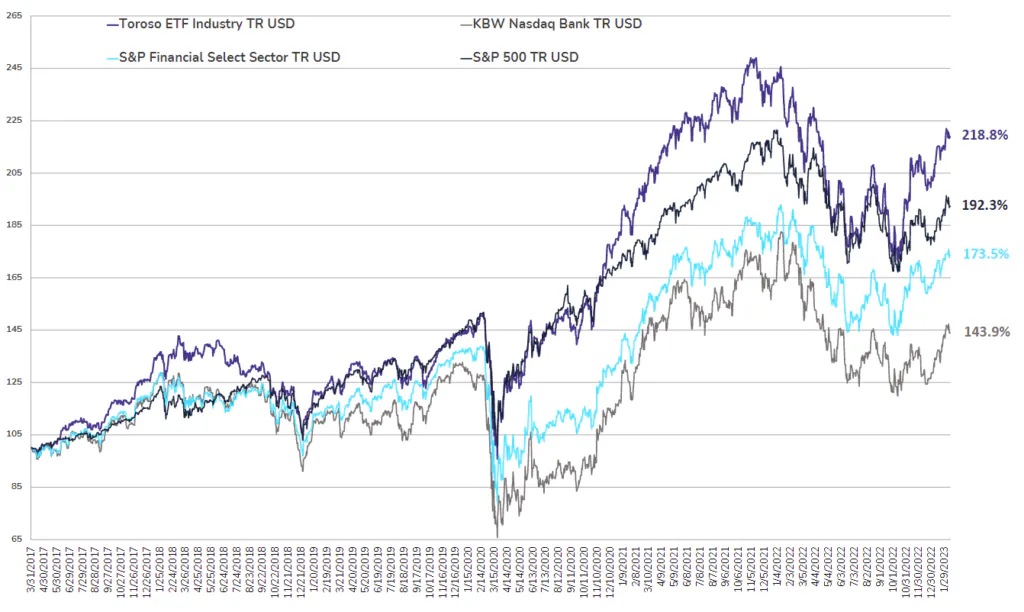
The highlighted indexes experienced similar performance last week. The Toroso ETF Industry Index was down -1.05% while the S&P Financial Select Sector Index led at -0.34%.
ETF Launches
Calamos Antetokounmpo Global Sustainable Equities ETF (ticker: SROI)
WisdomTree Voya Yield Enhanced USD Universal Bond Fund (ticker: UNIY)
Unusual Whales Subversive Democratic Trading ETF (ticker: NANC)
Unusual Whales Subversive Republican Trading ETF (ticker: KRUZ)
Simplify Propel Opportunities ETF (ticker: SURI)
Return Stacked Bonds & Managed Futures ETF (ticker: RSBT)
ETF Closures
AXS De-SPAC ETF (ticker: DSPC)
KFA Large Cap Quality Dividend ETF (ticker: KLCD)
KFA Small Cap Quality Dividend ETF (ticker: KSCD)
Fund/Ticker Changes
Goldman Sachs Defensive Equity Fund (ticker: GDEIX)
became Goldman Sachs Defensive Equity ETF (ticker: GDEF)
TETF.Index Performance vs. S&P Financial Select Sector Index (as of February 10, 2023)
TETF.Index Performance vs. Other Leading Financial Indices (March 31, 2017 through February 10, 2023)
Source: Morningstar Direct
Segments
See all
No specific market segments were tagged
Mentioned ETFs
No specific ETFs were tagged
Further reading



Latest publications
See allETF Industry KPIs – 12/16/2024
ETF Industry KPIs – 12/2/2024
ETF Industry KPIs – 11/18/2024
ETF Industry KPIs – 11/4/2024
ETF Industry KPIs – 10/28/2024
ETF Industry KPIs – 10/21/2024
ETF Industry KPIs – 10/7/2024
ETF Industry KPIs – 9/30/2024
ETF Industry KPIs – 9/16/2024
ETF Industry KPIs – 9/3/2024



Active Trader Report: Use of Leveraged & Inverse ETFs Way Up
Direxion partnered with Compound Insights and Vanda to explore what’s driving the evolution of active trading — and how active traders are using leveraged and inverse funds across equities, single stocks, commodities, and volatility.