Open Now: The Global ETF Survey Take the Survey →




ETF Industry KPI – 1/9/2023
This week, the industry experienced 1 ETF launch and 3 closures, shifting the 1-year Open-to-Close ratio to 2.94 and total US ETFs to 3,092.


This week, the industry experienced 1 ETF launch and 3 closures, shifting the 1-year Open-to-Close ratio to 2.94 and total US ETFs to 3,092.
Last week, we reviewed the 4th Quarter’s performance. As promised, this week we thoroughly review 2022’s 1-year metrics among our major KPI categories.
The ETF Industry Is Evolving Fast
From AI infrastructure to active strategies, the ETF landscape is shifting. Share your perspective in the 7th Annual Global ETF Survey and get exclusive early access to the final report.
> Total assets decreased approximately -9.78%, compared to increases of 32.27%in 2021, 23.54% in 2020, and 30.67% in 2019.
> Total ETF count increased by 291 to a total of 3,094.
> There were 29 more issuers by brand, an increase of 11.8%.
> From our 11 asset class categories, Managed Futures increased the most (364.4%) and Preferred Stock had the worst performance (-31.4%). The two largest asset classes of Equity (76.1% of assets) and Fixed Income (19.3%) shrank -12.6% and rose 2.8% respectively.
> > Although Equity’s dip dragged total assets down, the following categories increased their assets in 2022: Managed Futures (364.4%), Currency (59.3%), Options (38.4%), Fixed Income (2.8%), Commodities Derivative (2.6%), and Allocation (1.6%).
ETF expense ratio 12-month revenue decreased from $12.21 Billion to $10.99 Billion.
Exchanges: There was not a standout winner of the 3 major exchanges, but NYSE would receive our 3rd place medal. They were down -9.9% in assets (worst) and increased 8.8% in total funds (worst). Nasdaq was also down -9.4% in 2022 but took the big leap of 18.1% increase in total funds (+79). Lastly, CBOE was down -9.1% (best) and up 9.2% in total funds (+49). With that said, NYSE makes up 75.2% of total ETF assets and 64.5% of total funds.
ETF Revenue: While revenue from Active ETFs surged from 9.67% to 12.22%, Traditional and Non-Traditional had very differing performances. Traditional beta decreased from 47.56% of predicted 12-month revenue to 44.77% (-5.9%), while Non-Traditional beta grew slightly from 42.77% to 43.0% (0.5% increase).
Although Active funds expanded from 775 ETFs to 1026 ETFs (+251), it was still only 5.25% of total ETF assets.
The ETF industry had poor performance in 2022 along with overarching global markets, but there were still very positive signs of growth with new funds and issuers and an optimistic 4th quarter. Active ETFs continued to gain market share, though assets are still minimal. A full 2022 breakdown from the Tank will come in the following weeks, and it has been an honor covering another full year of ETF Industry KPIs!
Both indexes experienced similar reduction over 2022, the Toroso ETF Industry Index was down -15.73% while the S&P Financial Select Sector Index led at -10.53%.
ETF Launches
Pacer US Large Cap Cash Cows Growth Leaders ETF (ticker: COWG)
ETF Closures
Metaurus US Equity Cumulative Dividends Fund-Series 2027 ETF (ticker: IDIV)
VictoryShares Emerging Market High Div Volatility Wtd ETF (ticker: CEY)
ETFMG 2X Daily Alternative Harvest ETF (ticker: MJXL)
Fund/Ticker Changes
None
TETF.Index Performance vs. S&P Financial Select Sector Index
(as of January 6, 2023)

TETF.Index Performance vs. Other Leading Financial Indices
(March 31, 2017 through January 6, 2023)
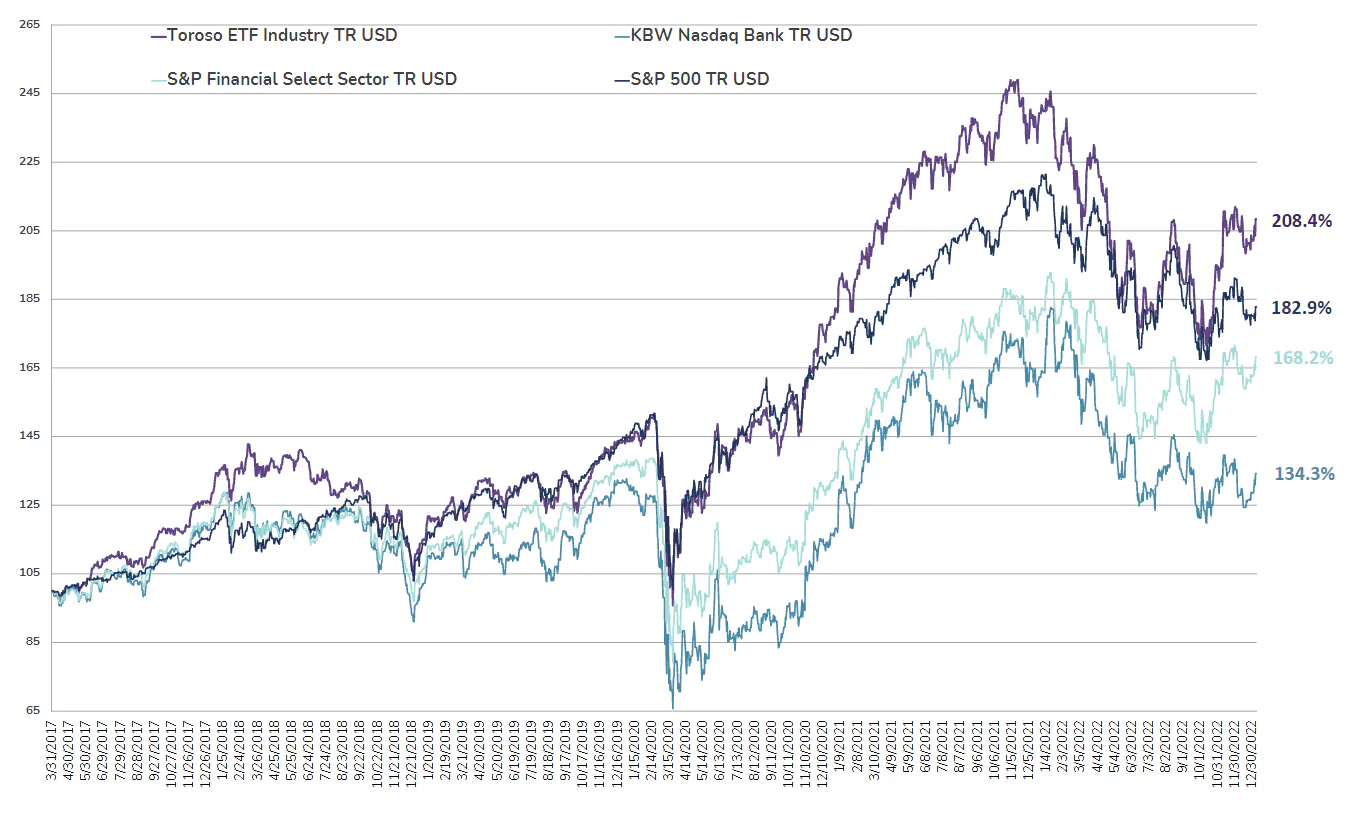
Source: Morningstar Direct
Segments
See all
No specific market segments were tagged
Mentioned ETFs
No specific ETFs were tagged
Further reading



Latest publications
See allETF Industry KPIs – 12/16/2024
ETF Industry KPIs – 12/2/2024
ETF Industry KPIs – 11/18/2024
ETF Industry KPIs – 11/4/2024
ETF Industry KPIs – 10/28/2024
ETF Industry KPIs – 10/21/2024
ETF Industry KPIs – 10/7/2024
ETF Industry KPIs – 9/30/2024
ETF Industry KPIs – 9/16/2024
ETF Industry KPIs – 9/3/2024



Active Trader Report: Use of Leveraged & Inverse ETFs Way Up
Direxion partnered with Compound Insights and Vanda to explore what’s driving the evolution of active trading — and how active traders are using leveraged and inverse funds across equities, single stocks, commodities, and volatility.