Open Now: The Global ETF Survey Take the Survey →



ETF Comparison: Invesco QQQ ETF (QQQ) Versus SPDR S&P 500 ETF Trust (SPY)
The top ETFs for the S&P 500 Index and Nasdaq-100 Index go head-to-head.


Keep up with what matters in ETFs
Get timely ETF insights, market trends, and top ideas straight to your inbox.
Your newsletter subscriptions with us are subject to ETF Central's Privacy Policy and Terms and Conditions.
Two of the most dominant indexes today are the S&P 500 and Nasdaq 100—I'd even go so far as to call them friendly rivals.
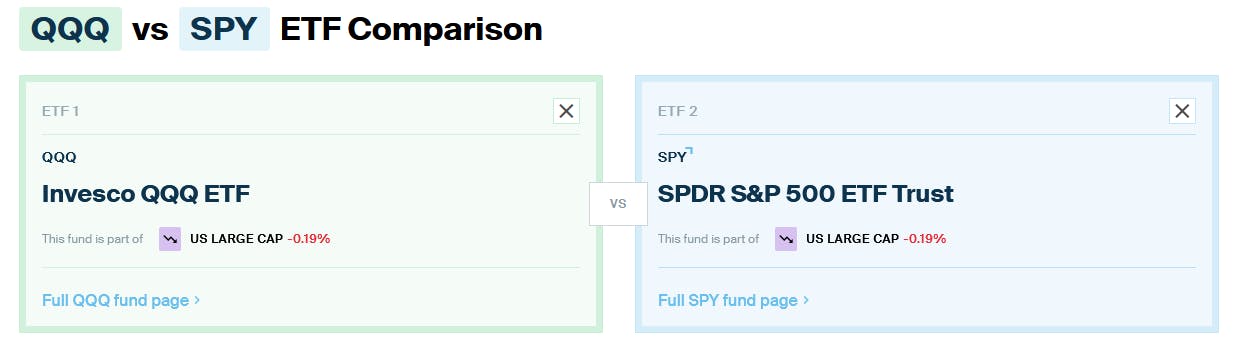
With their popularity comes a ton of ETF options, but none come so close in terms of sheer size, liquidity, and longevity as the two we're going to look at today: the Invesco QQQ ETF
We briefly touched on both QQQ and SPY in a previous article on the best ETFs for options trading, but here's a head-to-head comparison on all aspects courtesy of data from the ETF Central comparison tool.
The ETF Industry Is Evolving Fast
From AI infrastructure to active strategies, the ETF landscape is shifting. Share your perspective in the 7th Annual Global ETF Survey and get exclusive early access to the final report.
QQQ vs SPY: Total Cost of Ownership
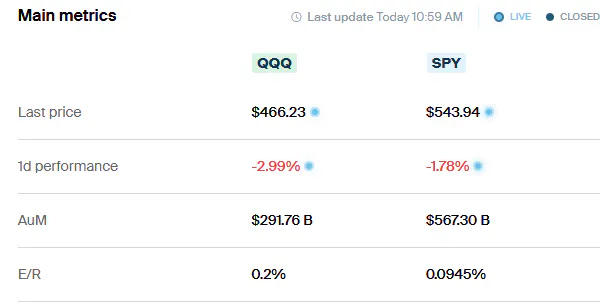
In terms of expense ratios, SPY takes the lead with a significantly lower expense ratio of 0.0945%, compared to QQQ's 0.20%.
Both ETFs are highly liquid, but SPY also has the edge in terms of bid-ask spreads, boasting a narrow 0.002% spread versus QQQ's 0.004%.
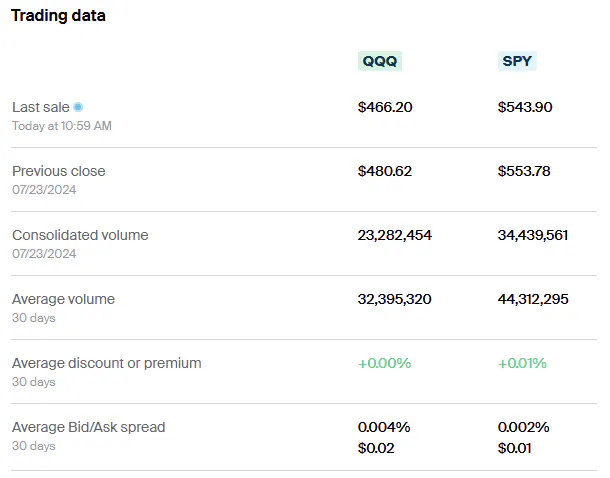
Combining these factors, SPY emerges as the more cost-effective ETF for both long-term ownership and active trading.
QQQ vs SPY: Methodology and Holdings
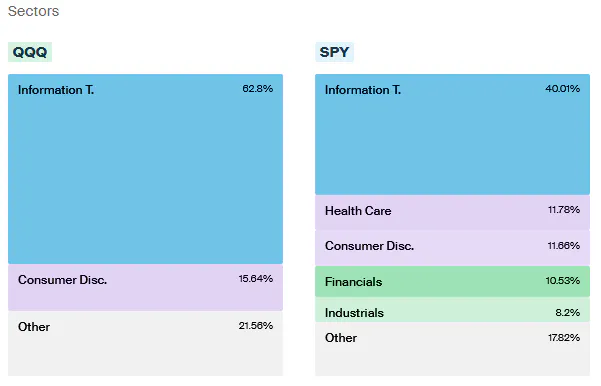
QQQ tracks the Nasdaq-100, which includes the largest 100 non-financial companies listed on the Nasdaq exchange, weighted by market capitalization. This index has a significant focus on technology and consumer discretionary sectors.
On the other hand, the S&P 500 is a broader index encompassing 500 of the largest U.S. companies selected by an S&P committee. These companies are screened for positive earnings, size, liquidity, and sector representation, including all 11 sectors.
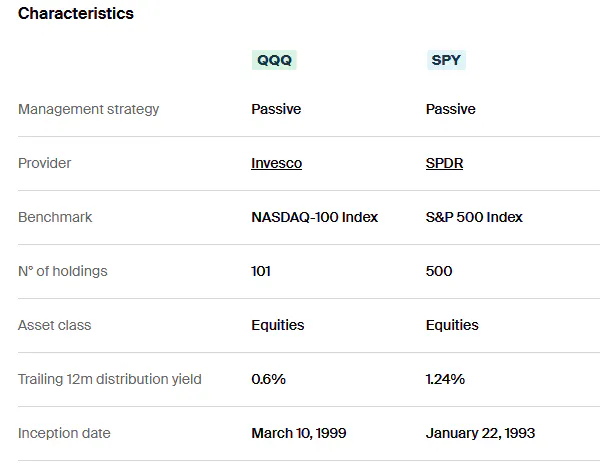
The result is that SPY offers much broader sector exposure compared to QQQ. SPY includes significant weights in financials, health care, industrials, and energy, among others, while QQQ heavily overweighs technology and consumer discretionary sectors and completely excludes financials.
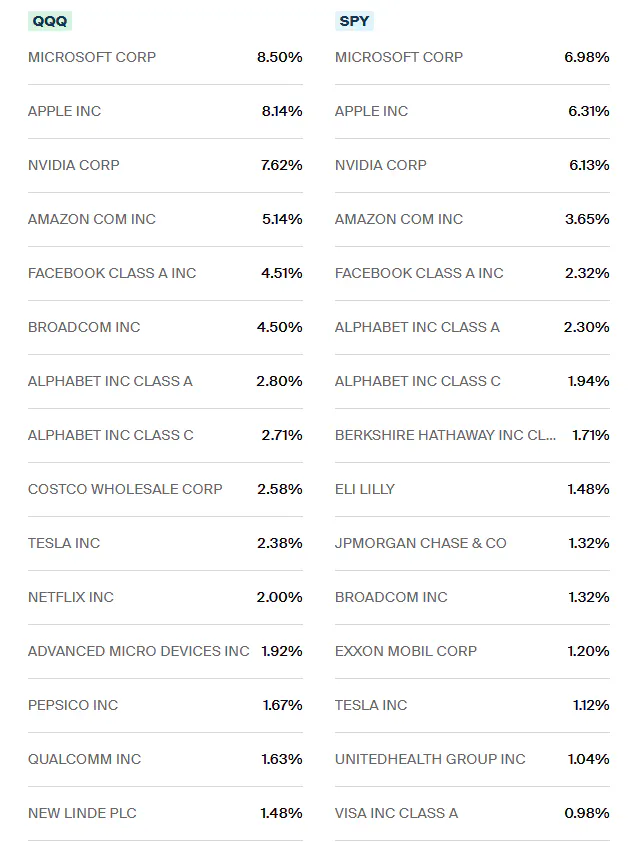
Top 15 holdings of each ETF show some similarities in the so-called "magnificent seven"—Apple, Microsoft, Nvidia, Amazon, Meta Platforms, Tesla, and Alphabet.
However, SPY also includes diversified heavyweights like Exxon Mobil, Visa Inc., Berkshire Hathaway, and JP Morgan Chase, which are excluded from QQQ due to the Nasdaq-only and non-financial company rules.
Furthermore, SPY is less top-heavy, with the top 15 holdings accounting for 39.79% of the portfolio, compared to 57.55% for QQQ.
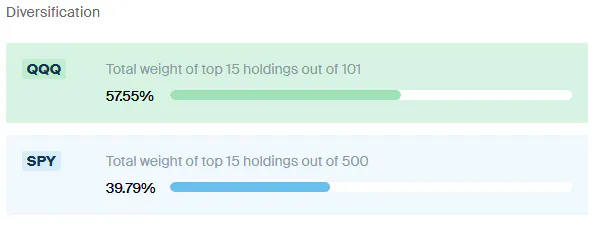
If you're looking for broad diversification, SPY is the clear winner. For mega-cap growth exposure with a tech tilt, QQQ is the better choice.
QQQ vs SPY: Risk and Return
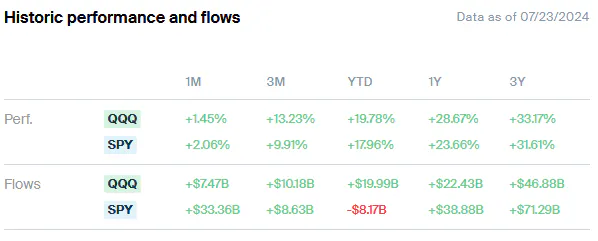
Over the past three, one, and year-to-date periods, QQQ has consistently outperformed SPY. This outperformance is not surprising, given the recent dominance of large-cap, growth stocks, and technology, which QQQ emphasizes. Both ETFs have also enjoyed substantial popularity, growing significantly with steady inflows totaling billions of dollars.
However, examining the long-term performance from 1999 to the present reveals a more nuanced picture. The backtest below shows that most of QQQ's outperformance has occurred since 2016. Before then, an investor in QQQ would have lagged behind SPY.
This disparity is largely due to the tech sector's terrible performance during the dot-com bubble, where QQQ suffered a massive 82.98% drawdown, coupled with substantially higher volatility, boasting a 27.23% standard deviation.
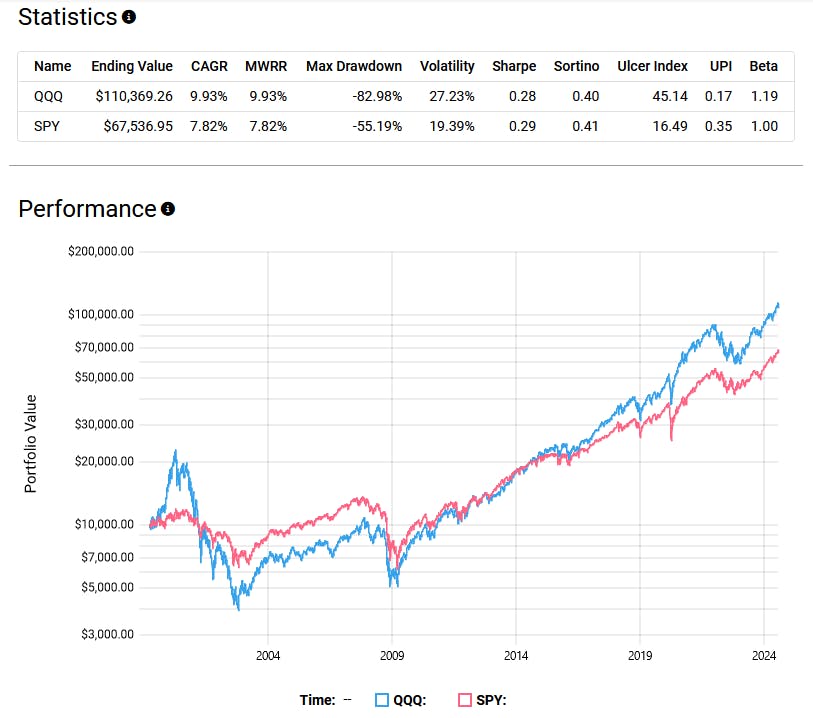
In recent years, the risk associated with QQQ remains markedly higher, with a higher three-year standard deviation and maximum drawdown. This was most notably observed during the 2022 bear market characterized by rising interest rates and high inflation, which severely impacted tech and growth stocks.
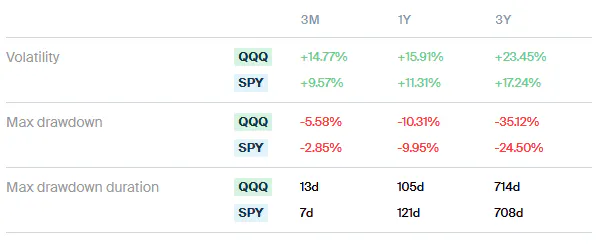
For these reasons, I prefer SPY. Overweighting tech represents an uncompensated risk, and based on Fama-French factors, I would expect value to outperform growth and smaller stocks to outperform mega-caps. This balanced exposure is where SPY excels.
Please note this article is for information purposes only and does not in any way constitute investment advice. It is essential that you seek advice from a registered financial professional prior to making any investment decision.

Latest ETF News
See all ETF newsThe Two Best Types of Fixed-Income ETFs For Managing Cash

ETF Comparison: Roundhill Generative AI & Technology ETF Versus iShares A.I. Innovation and Tech Active ETF

Crypto Income ETFs: Futures, Options, or Staking?

There’s an ETF for That? Air Conditioning Stocks




 Advantages of ETFs over Mutual Funds1/6
Lower Costs
In this guide, we'll explore the advantages of ETFs over mutual funds, giving you valuable insights into why ETFs have gained significant popularity among investors like yourself.
Leveraged ETFs: Unlocking the Potential for Amplified Returns1/6
Understanding Leveraged ETFs
Explore leveraged ETFs: potential for amplified returns & risks. 5 ETFs to consider across equities, commodities & fixed income.
What is a Leveraged ETF?1/6
Introducing Leveraged and Inverse ETFs
In this guide, we'll dive into the world of leveraged ETFs, exploring their definition, mechanics, potential risks, and rewards.
Recent educational content

ETF Trends
ETF Industry KPIs July 13, 2026
This week’s KPI data overview highlights key metrics and trends shaping the ETF landscape.


First Look ETF
First Look ETF: Cash Deployment, Bond, and Hedged ETFs
In this season 6 episode of First Look ETF, Stephanie Stanton examines the latest ETF marketplace trends with NYSE and guests.

ETF Trends
ETF Industry KPIs July 6, 2026
This week’s KPI data overview highlights key metrics and trends shaping the ETF landscape.
Asset TV
The ETF Show - The Evolution of Leveraged & Inverse ETFs
Leveraged and inverse ETFs have exploded in popularity over the past decade capturing more assets as retail traders seek to capture volatility.

Browse all educational columns



Build and Analyze Your ETF Portfolio Like a Pro
Create your own ETF portfolio in minutes and instantly see allocations, exposures, performance, and risk. Visualize diversification across asset classes, regions, and sectors. Stress-test ideas, compare benchmarks, and refine your strategy with professional-grade analytics.
